. 2017 Dec 11;6:e32337. doi: 10.7554/eLife.32337

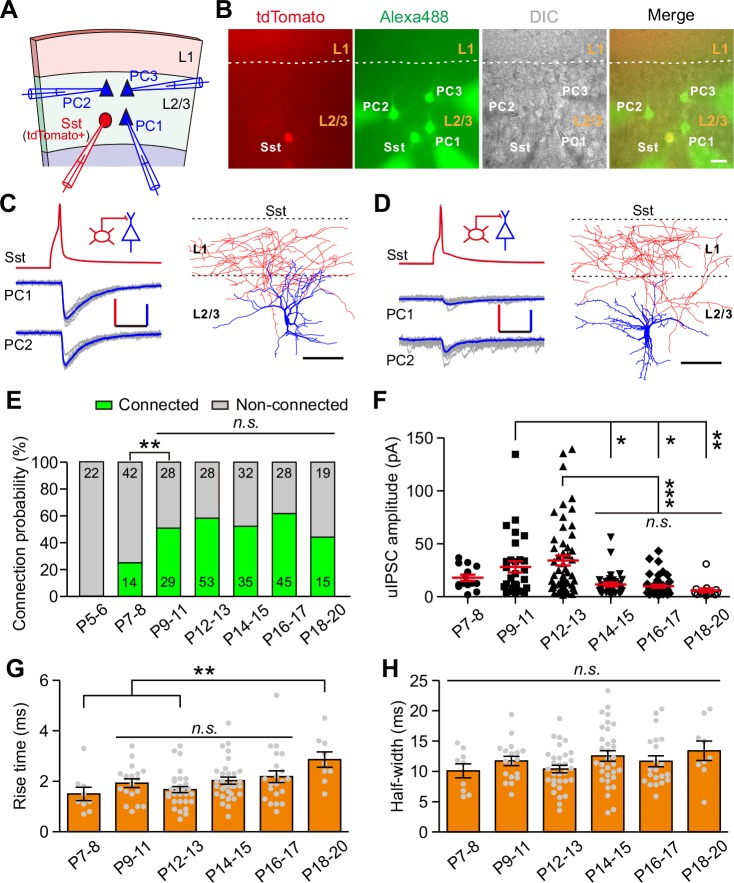
Figure 1. Development of synaptic transmission from Sst-INs onto PCs in layer 2/3 of the visual cortex.

(A) Schema of a quadruple whole-cell recording from an Sst-IN (red) and three PCs (blue) in layer 2/3. (B) Representative fluorescent (tdTomato, Sst-INs; Alexa 488, recorded neurons), IR-DIC, and merged images of a quadruple recording of an Sst-IN and three PCs. The dashed lines indicate the border between layer 1 and layer 2/3. Scale bar, 20 μm. (C) Left, representative traces showing synaptic transmission from an Sst-IN to two PCs recorded at P11. The red and blue lines indicate the averaged traces. Scale bars: 50 mV (vertical, red), 25 pA (vertical, blue), and 20 ms (horizontal). Right, morphological reconstruction of the Sst-IN. Scale bar: 80 µm. (D) Left, representative traces showing synaptic transmission from an Sst-IN to two PCs recorded at P15. Scale bars: 50 mV (vertical, red), 25 pA (vertical, blue), and 20 ms (horizontal). Right, morphological reconstruction of the Sst-IN. Scale bar: 80 µm. (E) The probability of synaptic connection from Sst-INs to PCs at P5–20. Data label indicates the number of pairs in each group. A total of 391 pairs were recorded from 82 mice. (F) Quantification of the peak amplitude of uIPSCs from Sst-INs to PCs at different postnatal ages. (G–H) Quantification of the 10–90% rise time (G) and half-width (H) of uIPSCs at P7–20. Detailed statistical analysis, detailed data, and exact sample numbers are presented in Figure 1—source data 1. Error bars indicate mean ±SEM. *p<0.05; **p<0.01; ***p<0.001; n.s., p>0.05.

Figure 1—source data 1. Detailed statistical analysis, detailed data, exact sample numbers, and p values in Figure 1 and Figure 1—figure supplement 14.
DOI: 10.7554/eLife.32337.007

Figure 1.

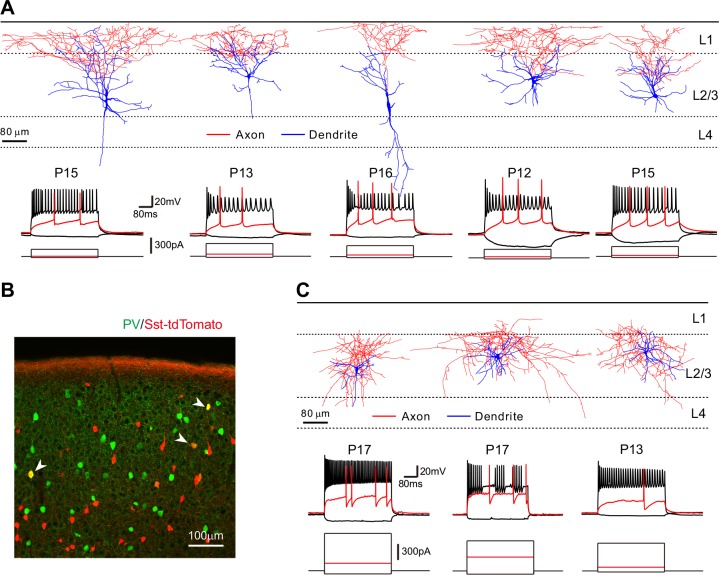
Figure 1—figure supplement 1. Morphological and electrophysiological properties of tdTomato+ neurons in Sst-tdTomato mice.

Figure 1—figure supplement 1.

(A) Top panel, the morphologies of reconstructed non-FS tdTomato+ neurons in layer 2/3 of visual cortex. Bottom panel, corresponding traces of voltage responses to 500 ms current pulse step injections recorded in the current-clamp mode. (B) Some tdTomato+ cells in Sst-tdTomato line expressed PV. Arrowheads indicated PV+/tdTomato+ cells. (C) Top panel, the morphologies of reconstructed fast-spiking tdTomato+ cells. These cells are basket-like interneurons, with dense axonal arborization in layer 2/3. Bottom panel, corresponding membrane voltage responses of cells to current injections.
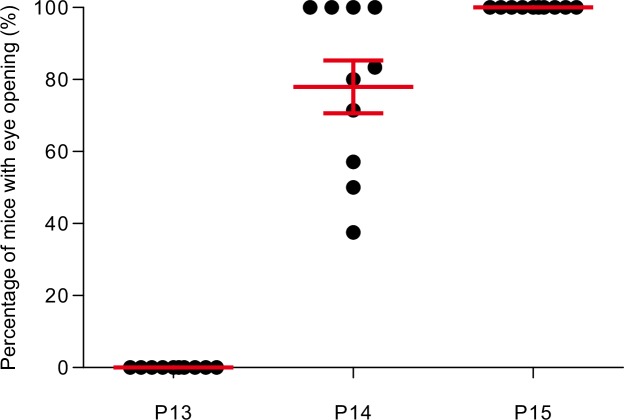
Figure 1—figure supplement 2. The timing of eye opening in mice.

Figure 1—figure supplement 2.

Quantification of mice undergoing eye opening in each litter (n = 10) from P13 to P15. There were no mice with opened eyes at P13. At P14, 77.9% ± 7.4% of mice had opened eyes; at P15, 100% of mice had opened eyes.
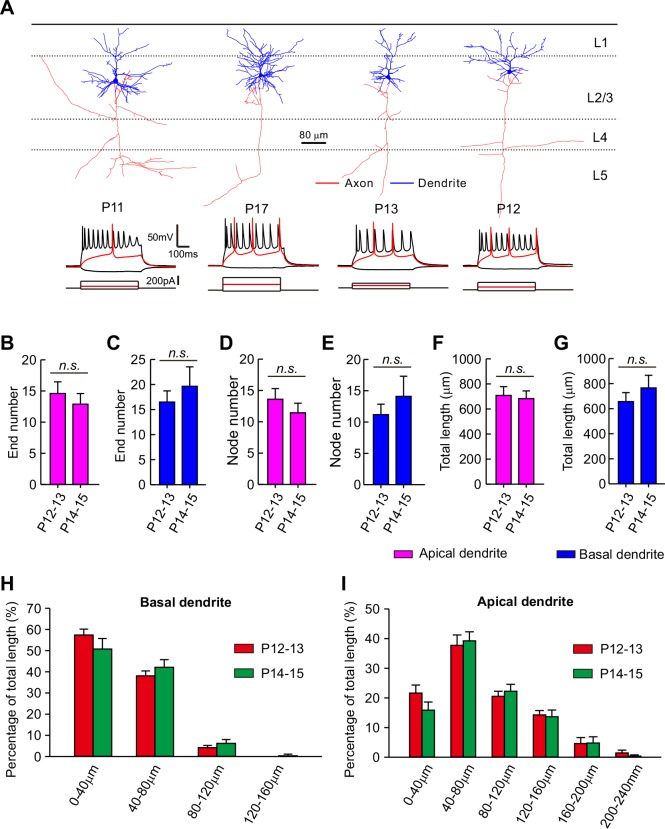
Figure 1—figure supplement 3. Dendritic morphology of PCs does not change significantly before and after eye opening.

Figure 1—figure supplement 3.

(A) The morphological identity of recorded PCs. Top panel, the morphologies of reconstructed PCs. Bottom panel, corresponding membrane responses of PCs to current injections. (B–G) Quantification of the end number of apical dendrites (B), the end number of basal dendrites (C), the node number of apical dendrites (D), the node number of basal dendrites (E), the total length of apical dendrites (F), and the total length of basal dendrites (G) between P12–13 (before eye opening) and P14–15 (after eye opening). (H–I) Sholl analysis of dendritic length per 40 μm radial unit distance from the soma. Detailed statistical analysis, detailed data, and exact sample numbers are presented in Figure 1—source data 1. n.s., p>0.05.
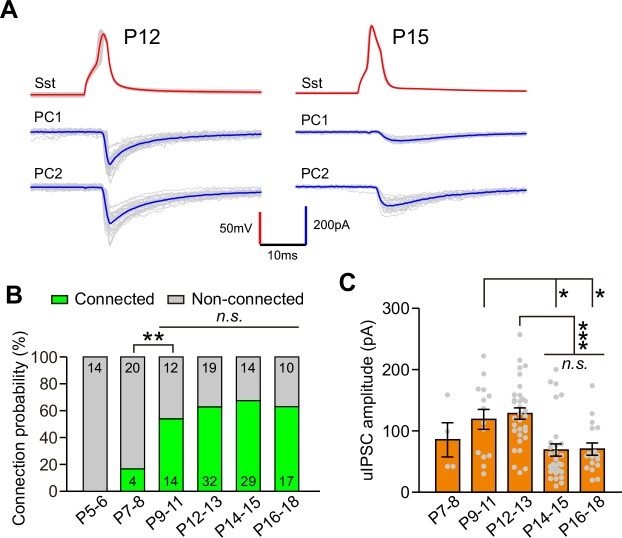
Figure 1—figure supplement 4. Synaptic responses from Sst-INs to PCs recorded with a cesium-based intracellular solution.

Figure 1—figure supplement 4.

(A) Representative traces showing synaptic transmission from Sst-INs to PCs recorded at P12 and P15, respectively. Postsynaptic responses were recorded with a cesium-based intracellular solution containing 60 mM Cl-. (B) Summary of connection probability. (C) Quantification of the peak amplitude of Sst-IN→PC uIPSCs. Detailed statistical analysis, detailed data and exact sample numbers are presented in Figure 1—source data 1. *p<0.05; **p<0.01; ***p<0.001; n.s., p>0.05.