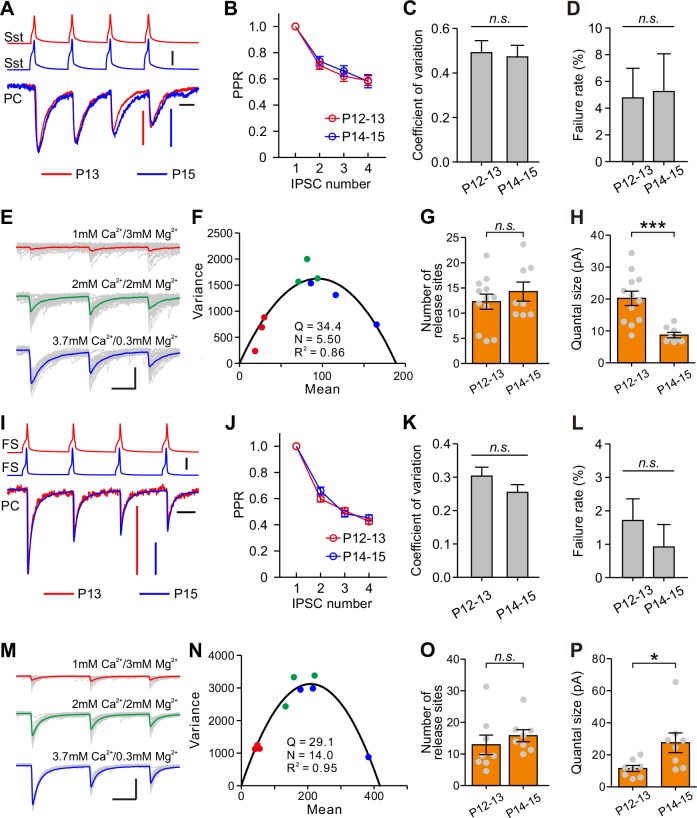
Figure 7. Postsynaptic mechanisms underlying the changes of synaptic transmission from Sst-INs to PCs and from FS-INs to PCs.
(A) Amplitude-scaled overlay of paired-pulse ratio (PPR) responses in Sst-IN→PC connections at P13 and P15. Red, P13; blue, P15. Scale bars: 20 pA (vertical red), 10 pA (vertical, blue), 50 mV (vertical, black), and 20 ms (horizontal). Four presynaptic action potentials were evoked at 20 Hz. (B) The normalized peak amplitude of Sst-IN→PC uIPSCs showed short-term depression, and no significant difference in PPR was found between P12–13 (red) and P14–15 (blue) mice. (C) The coefficient of variation (C.V.) in Sst-IN→PC connections did not change from P12–13 to P14–15. (D) The failure rate in Sst-IN→PC connections did not change from P12–13 to P14–15. (E) Representative uIPSC responses from an Sst-IN to a PC evoked by a train of 3 presynaptic action potentials at 20 Hz under three different external Ca2+/Mg2+ concentrations. The postsynaptic cells were recorded with Cs-based and high Cl- intracellular solution. Scale bars: 100 pA (vertical) and 20 ms (horizontal). (F) The parabola plot of the variance and mean of the peak amplitude of Sst-IN→PC uIPSCs in (E) under three different external Ca2+/Mg2+ concentrations. Red dots, 1 mM Ca2+/3 mM Mg2+; green dots, 2 mM Ca2+/2 mM Mg2+; blue dots, 3.7 mM Ca2+/0.3 mM Mg2+. (G) The number of release sites in Sst-IN→PC connections did not change from P12–13 to P14–15. (H) The quantal size in Sst-IN→PC connections significantly decreased from P12–13 to P14–15. (I) Amplitude-scaled overlay of paired-pulse ratio (PPR) responses in FS-IN→PC connections at P13 and P15. Red, P13; blue, P15. Scale bars: 100 pA (vertical red and blue), 50 mV (vertical, black), and 20 ms (horizontal). (J) PPR in FS-IN→PC connections was similar between P12–13 (red) and P14–15 (blue) mice. (K) The coefficient of variation (C.V.) in FS-IN→PC connections was unchanged from P12–13 to P14–15. (L) The failure rate in FS-IN→PC connections did not change from P12–13 to P14–15. (M) Representative uIPSC responses from an FS-IN to a PC evoked by a train of 3 presynaptic action potentials at 20 Hz in different external Ca2+/Mg2+ concentrations. Scale bars: 200 pA (vertical) and 20 ms (horizontal). (N) The parabola plot of the variance and mean of uIPSC amplitude in (M) at different external Ca2+/Mg2+ concentrations. Red dots, 1 mM Ca2+/3 mM Mg2+; green dots, 2 mM Ca2+/2 mM Mg2+; blue dots, 3.7 mM Ca2+/0.3 mM Mg2+. (O) The number of release sites in FS-IN→PC connections did not change from P12–13 to P14–15. (P) The quantal size in FS-IN→PC connections significantly increased from P12–13 to P14–15. Detailed statistical analysis, detailed data, and exact sample numbers are presented in Figure 7—source data 1. Error bars indicate mean ±SEM. *p<0.05; ***p<0.001; n.s., p>0.05.

