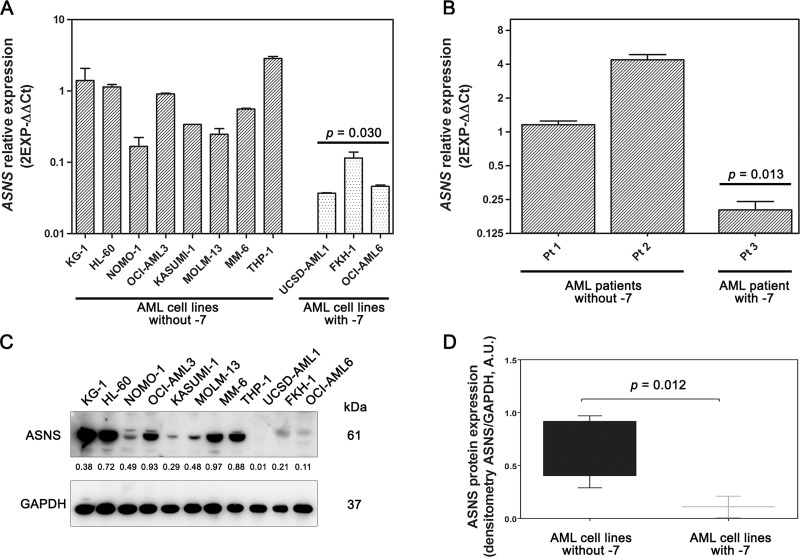
Figure 2. Gene and protein expression of ASNS in AML samples.
AML cell lines (A) and AML primary cells (B) with -7 displayed low amount of ASNS transcript. Bars represent 2−ΔΔCt value. Gene expression was normalized to GAPDH and ATP5B housekeeping genes. Data are expressed as mean ± SD of three independent experiments. Statistical analysis (Unpaired t test) was performed to compare mean relative mRNA abundance between AML cells, with or without -7. (C) Western blot analysis showing low amount of ASNS protein in AML cell lines with -7. Thirty micrograms of protein were blotted to each lane. Antibody to GAPDH served as a loading control. (D) The amount of ASNS protein, determined by densitometric analysis and normalized to GAPDH density, was significantly lower in AML cells with -7 (p = 0.012, Mann Whitney test).

