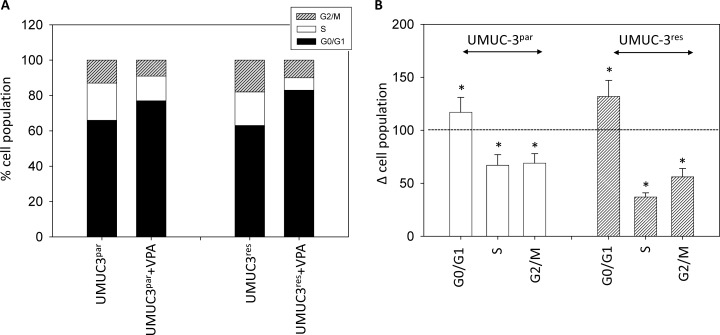
Figure 5. Cell distribution in the different cell cycle phases.
(A) Percentage of parental and resistant UMUC-3 in G01/1, S and G2/M phase is indicated. Bladder cancer cells were pre-treated with VPA [1 mmol/ml] for 3 days. Controls remained untreated. One representative of three separate experiments is shown. (B) % difference of UMUC-3par and UMUC-3res exposed to VPA [1 mmol/ml] compared with the corresponding untreated controls. Control phases were set to 100%. Bars indicate standard deviation (SD). *indicates significant difference to control, p ≤ 0.05. n = 5.

