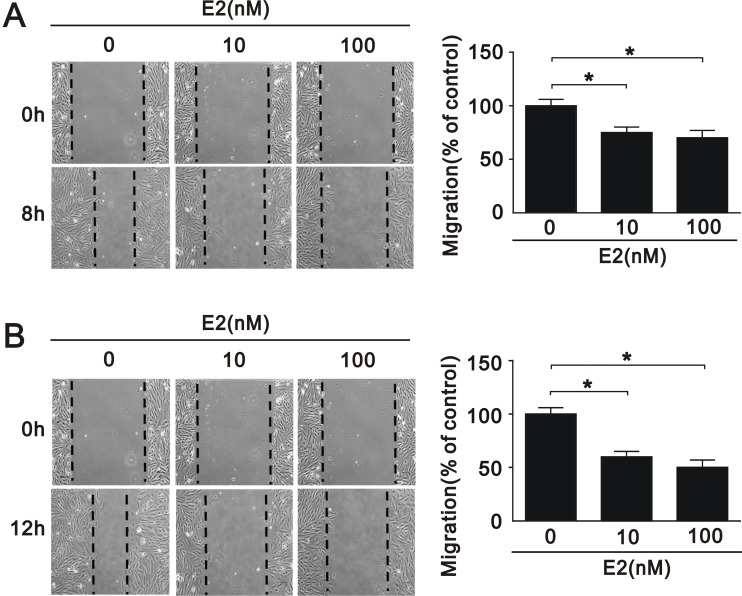
Figure 4. Migration of A7r5 cell treated with E2.
Wound healing assays were performed on A7r5 cells treated with 10 nM and 100 nM E2 for (A) 8 h and (B) 12 h. Black arrows indicate the wound edge. The residual gap between the migrating cells from the opposing wound edge is expressed as a percentage of the initial scraped area. Data are expressed as mean ± SD. Representative data shown are from experiments performed independently at least 3 times. *p < 0.05

