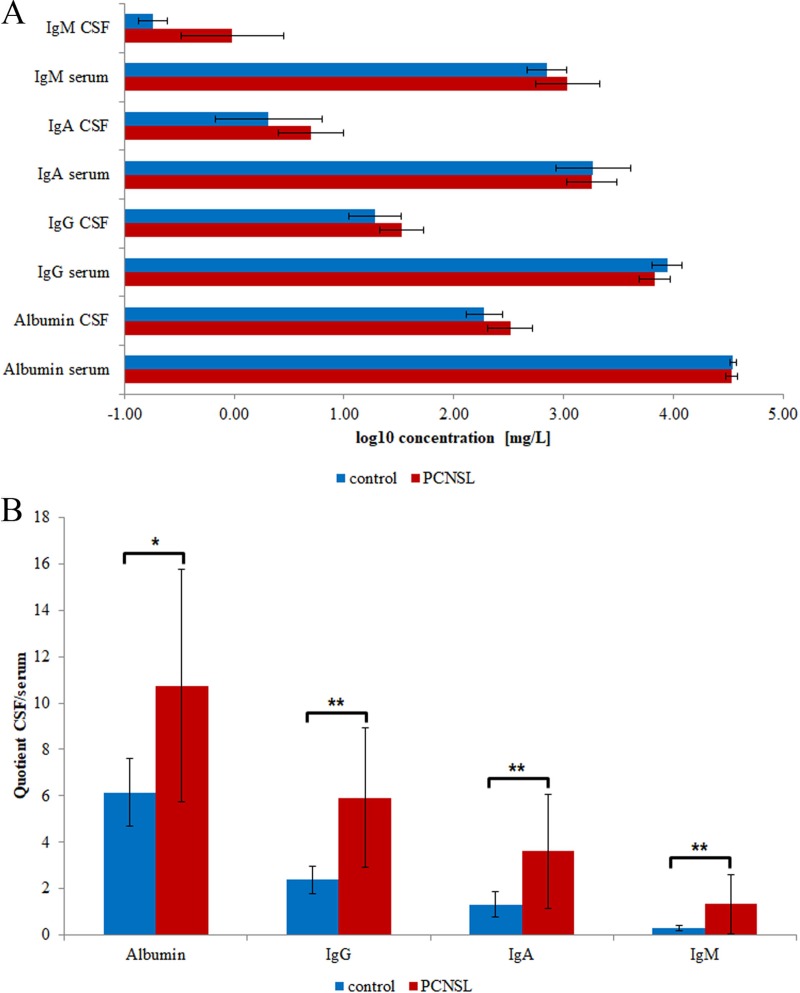
Figure 1. Clinical data of participating individuals.
The mean values and corresponding standard deviations are shown. (A) Concentrations of albumin, IgG, IgA and IgM in CSF and serum. (B) CSF/serum concentration quotients of albumin, IgG, IgA and IgM. Significance levels: p < 0.05 (*), p < 0.01 (**).

