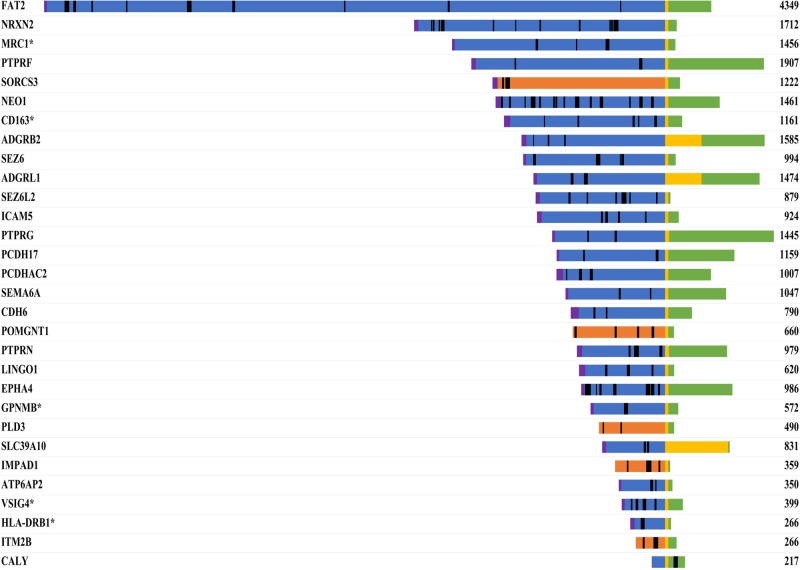
Figure 7. Sequence mapping of identified peptides onto the specific amino acid sequences of transmembrane proteins.
Proteins that were more abundant in the CSF of PCNSL patients are marked with an asterisk. The number represents the length of the protein (amino acids). Color code: blue, extracellular; yellow, transmembrane region; green, cytoplasmic; orange, luminal; magenta, signal peptide; black, identified peptides.

