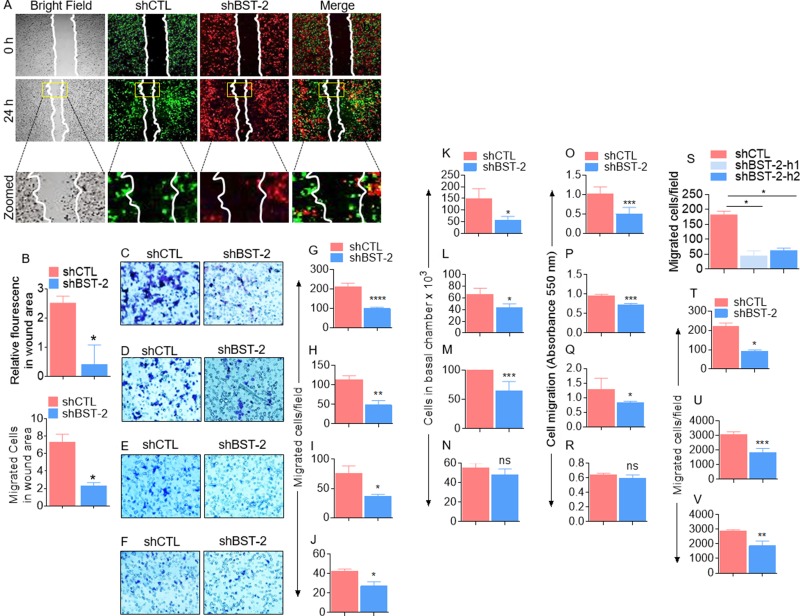
Figure 1. BST-2 broadly promotes cancer cell migration.
(A) Representative images of 4T1 shCTL (green) and shBST-2 (red) cells mixed 1:1 and co-cultured prior to wound healing assay performed at the indicated times. White lines on images depict initial wound border (0 h) and extent of wound closure (24 h). Area inside the yellow boxes is zoomed for each cell type in row 3. (B) Quantitation of relative mean fluorescence intensity (MFI, top) and cell numbers (bottom) that migrated into the wound area (yellow rectangle on images) at 24 h time point normalized to 0 h time point. (C–R) Representative experiments showing the effect of BST-2 on migration of isogenic 4T1, 4T07, 168FARN, 67NR shCTL and shBST-2 cell lines as analyzed by parallel assays including: (C–F) Microscopic imaging of Giemsa stained cells on the basal side of the trans well inserts. (G–J) Image J quantitation of trans well migration events. K-N. Hemocytometer-based enumeration of basal chamber cells. O-R. Spectrophotometric absorbance-based quantitation of migration events. (S) Migration rate of MDA-MB-231 shCTL, shBST-2-h1, and shBST-2-h2 cells. (T–V) Quantification of trans well migration of other non-breast cancer TZM-bl, SUP-T1, U937 cell lines expressing shCTL and shBST-2. For migration assays, cells from five different fields were blind-counted and values averaged. Error bars represent standard deviations. Significance was taken at P < 0.05*, P <0.01**, P < 0.001***, and P < 0.0001****. ns = not significant. Experiments were repeated more than three time with similar results.

