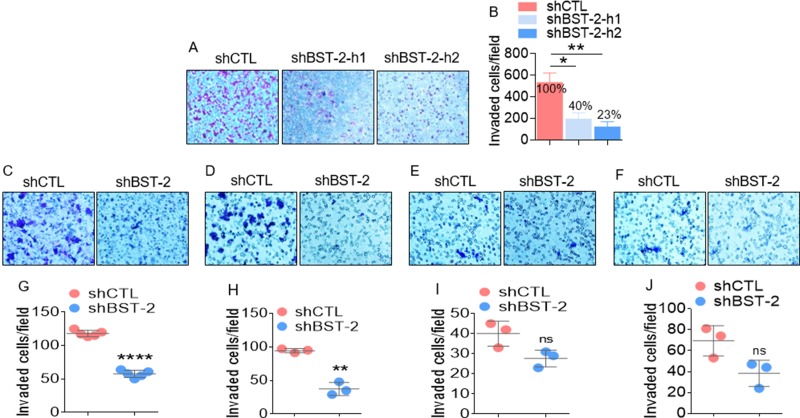
Figure 2. BST-2 broadly promotes invasion of cancer cells.
(A–B) Representative images and quantification of invasion rates of MDA-MB-231 shCTL, shBST-2-h1, and shBST-2-h2 cells through Matrigel-coated culture inserts. Numbers on graph in panel B represent % decrease in invasion. (C–F) Representative microscopic images of Giemsa-stained invaded isogenic 4T1, 4T07, 168FARN, 67NR shCTL and shBST-2 cells. (G–J) Image J quantitation of trans well invasion events shown in panels (C–F) In all experiments, cells from three to five different fields were blind-counted and values averaged or plotted as individual points. Error bars represent standard deviations. Significance was taken at P < 0.05*, P < 0.01**, and P < 0.0001****. ns = not significant. Experiments were repeated more than three time with similar results.

