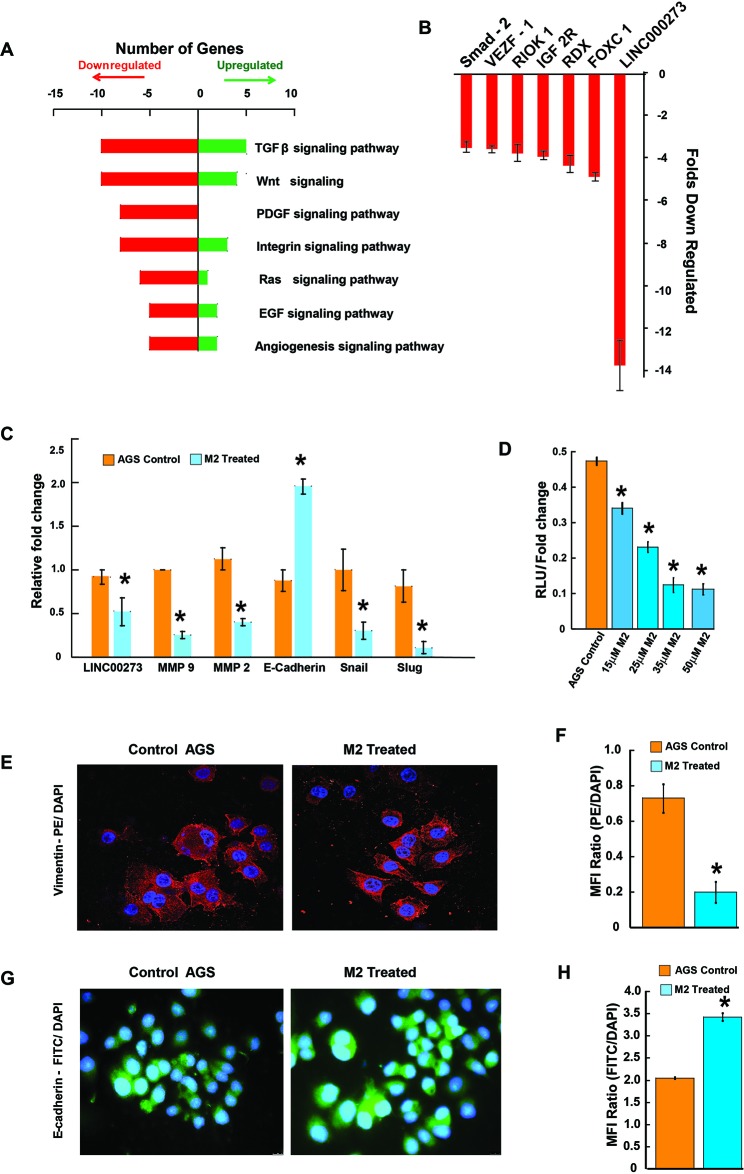
Figure 3. Tracing the molecules and pathways inhibited by M2 in preventing cancer cell migration and invasion.
(A-B) Graphical representation of microarray (Affymetrix) analysis showing some significantly upregulated or downregulated genes of important signaling pathways. (C) qPCR data showing relative fold changes in gene expressions related to cell migration and invasion in M2 treated AGS cells in comparison to untreated AGS controls. (D) Dual luciferase assay showing a dose dependent decrease in relative luciferase units indicating inhibition of LINC00273 transcription in presence of various concentrations of M2. (E) Representative fluorescent microscopic images of PE-tagged vimentin expression. (F) Bar diagram representation of the ratio of PE: DAPI Mean Fluorescence Intensity. (G) Representative fluorescent microscopic images of FITC-tagged E-cadherin expression. (H) Bar diagram representation of the ratio of FITC: DAPI Mean Fluorescence Intensity. (n=3 biological replicates, error bars denote s.e.m.). *p value<0.005, relative to Control.

