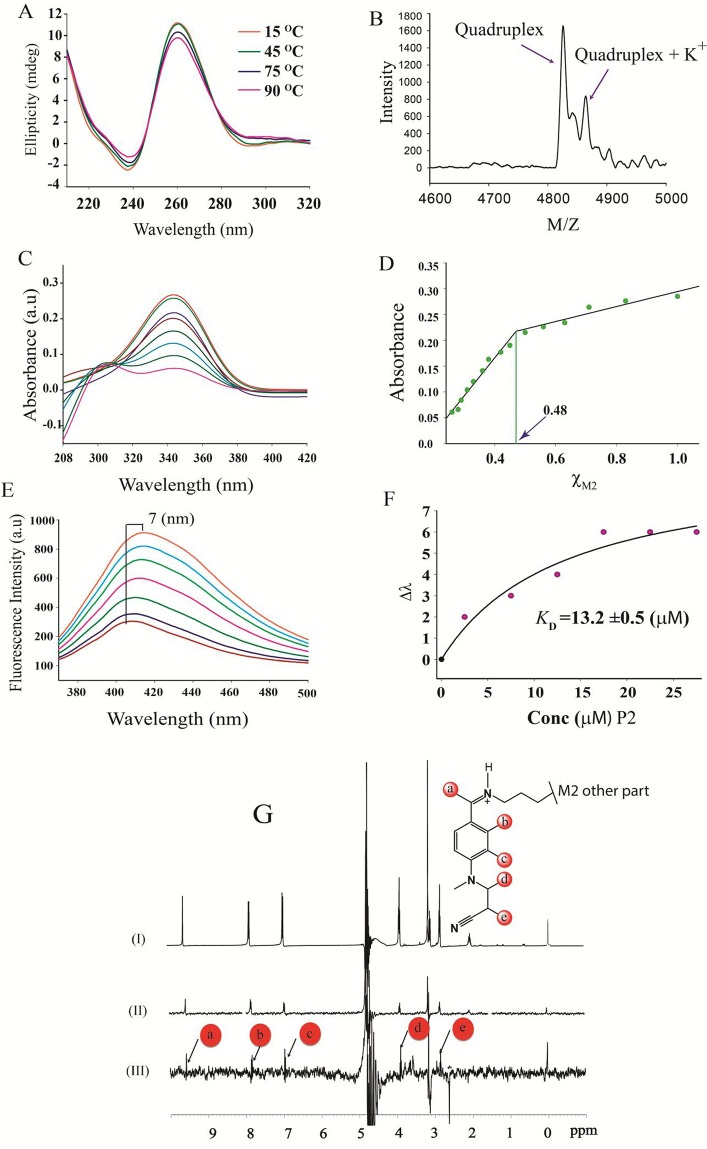
Figure 4. Spectroscopic Investigations.
(A) CD melting profile of P2-M2 complex. (B) MALDI-TOF spectra of P2 revealed intramolecular quadruplex formation. (C) Absorption spectra of M2 with increasing concentration of P2. (D) Job's plot analysis showed 1:1 complex formation for P2-M2 complex. (E) Fluorescence spectra of M2 with increasing concentration of P2. (F) Equilibrium dissociation constant (KD) calculated from the plot of Δλ (change in wavelength) vs. concentration of P2. (G) (I) One dimensional NMR spectrum of M2. (II) One dimensional reference Water-LOGSY spectrum of M2 and (III) Water-LOGSY spectrum of M2-P2 complex.

