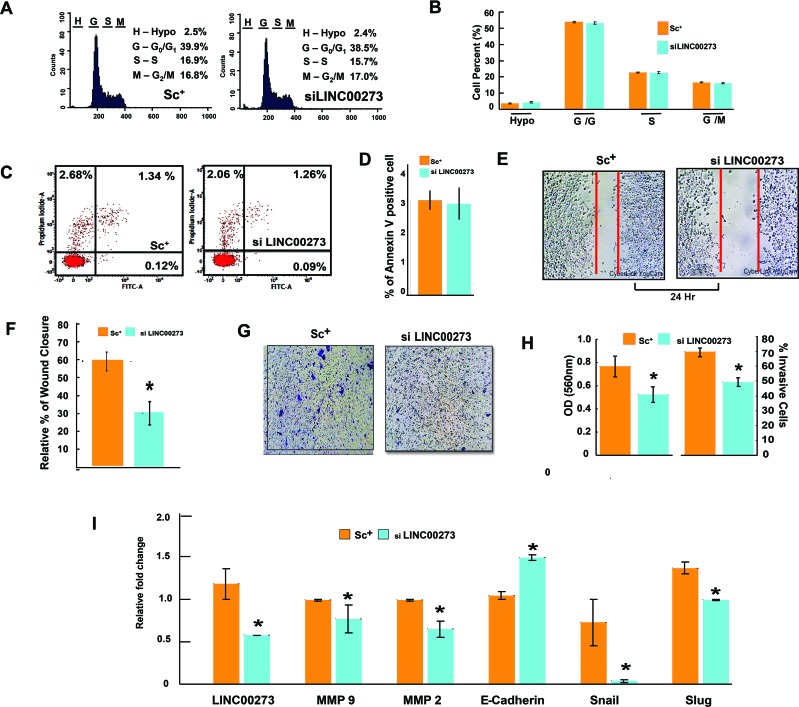
Figure 7. Effect of LINC00273 gene knockdown [using short interfering RNAs (siRNAs)] on AGS cells.
(A) Cell cycle phase distribution detected in a flowcytometer. Histogram display of DNA content (x-axis, PI-fluorescence) vs. counts (y-axis) has been shown. (B) Bar diagram representation of cell cycle phase distribution of scrambled siRNA control and si LINC00273 treated AGS. (C) FITC tagged Annexin V/PI Assay of AGS cells. Dual parameter dot plot of FITC-fluorescence (x-axis) vs. PI-fluorescence (y-axis) has been shown in logarithmic fluorescence intensity. In a double label system, scrambled siRNA control and si LINC00273 treated AGS cells were labeled with PI and Annexin V and analyzed on a Flowcytometer. (D) Bar diagram representation of percent Annexin V positive scrambled siRNA control AGS cells and si LINC00273 treated AGS cells. (E-F) Wound-healing assay to study AGS cell migration following si LINC00273 transfection. (G-H) Microscopic observation (×10) of AGS cells on the bottom of the Boyden's chamber at the end of the 24 h. Percentage of scrambled siRNA control and si LINC00273 treated AGS cells which have invaded to the lower chamber is shown graphically. (I) qPCR data showing relative fold changes in gene expressions related to cell migration and invasion in si LINC00273 treated AGS cells in comparison to scrambled siRNA control AGS. (n=3 biological replicates, error bars denote s.e.m.). *p value<0.005 relative to Scramble Control.

