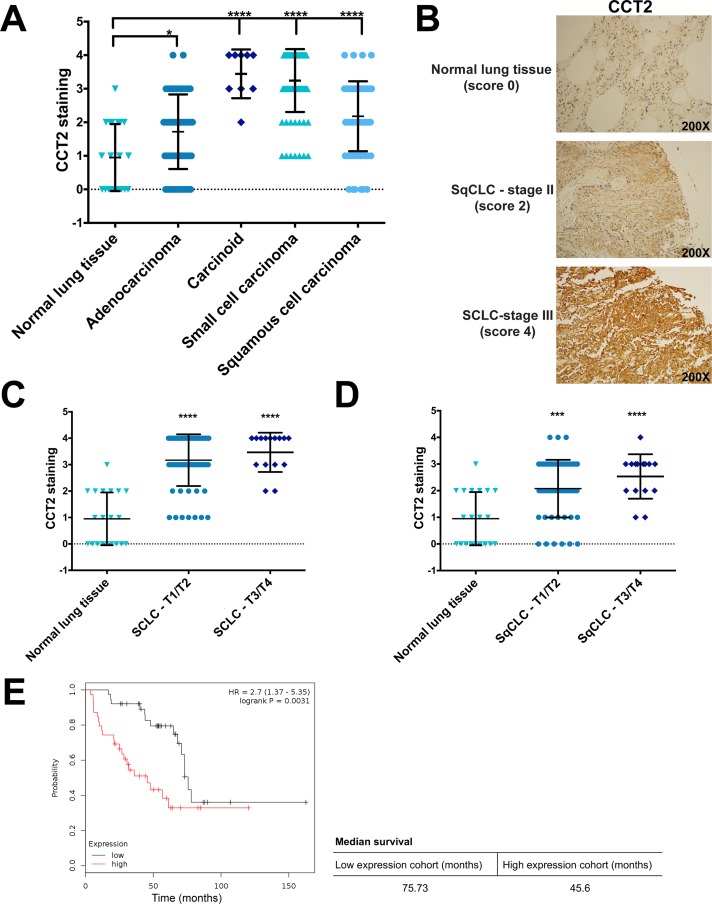
Figure 1. Analysis of CCT2 staining in lung cancer patient tissue.
(A) The levels of CCT2 were assayed in human tumor tissue samples of different lung cancer subtypes by immunohistochemistry (IHC) as described in Materials and Methods. Tissue cores were analyzed by a pathologist according to stain intensity and given a score between 0-4 as previously published in Bassiouni et al (2016). Significance was calculated in reference to normal lung tissue. Number of samples used for the analysis can be found in Supplementary Table 1. (B) Representative images of stained human tissue microarrays (TMAs) shows the elevated levels of CCT2 in both squamous cell carcinoma and small cell carcinoma compared to low levels in normal lung tissue. (C) Small cell lung cancer (SCLC) samples were grouped according to TNM score (T1/T2 and T3/T4) and stain intensity for CCT2 was compared between them. Significance indicated is in reference to normal lung tissue. (D) Squamous cell lung carcinoma (SqCLC) was also grouped by TNM score (T1/T2 and T3/T4) and CCT2 stain intensity was compared. Significance indicated is in reference to normal lung tissue. (E) Kaplan-Meier plot of lung cancer patients based on CCT2 expression. The survival graph was generated using publicly available database (KM plotter; www.kmplot.com). Data analysis was restricted to patients with grade III lung cancer (n=77). * = p<0.05, ** = p<0.01, *** = p<0.001, **** = p<0.0001.

