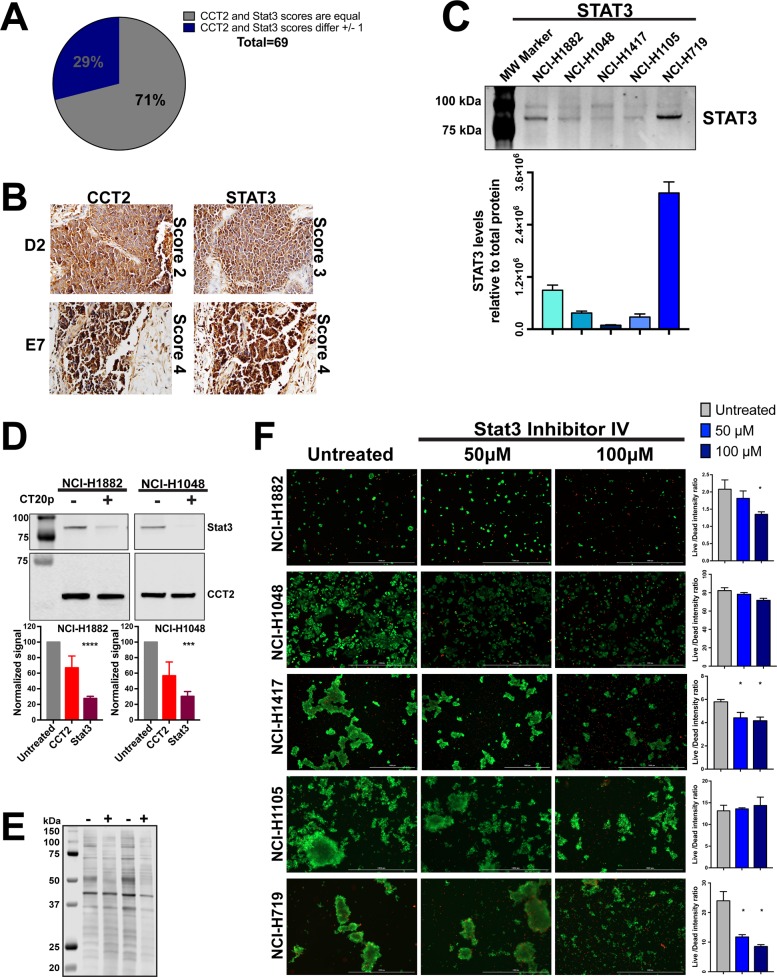
Figure 4. CT20p-NPs treatment decrease levels of client protein Stat3 in SCLC cell lines.
(A-B) TMA containing human SCLC tissue was stained for CCT2 and Stat3 in parallel as described in Methods and Materials. Number of samples and specific TMA information can be found in Supplementary Table 5. Tissue cores were analyzed by a pathologist according to stain intensity as described in Figure 1. (A) Pie chart indicates the number of cores which received equal scoring for CCT2 and Stat3 staining, as well as cores which received scores that differed by 1 (no cores received scores that differed by more than 1). (B) Representative images of corresponding CCT2 and Stat3 stained TMA cores D2 and E7 respectively. Images were provided by the pathologist at 200X (D2 pair) and 400X (E2 pair). (C) Immunoblot showing relative levels of Stat3 in the five SCLC cell lines. Levels of Stat3 shown were normalized to total protein as in Figure 2A-2C. Calculations are described in Methods and Materials. (D) Cell lines NCI-H1882 and NCI-H1048 were treated with 75 μg/ml CT20p-NPs for 16 hours and 6 hours respectively, at which point cells were trypsonized and lysates made. Soluble lysates of untreated cells (cultured in parallel with treated cells and lifted at the same time) were immunoblotted for CCT2 and Stat3. Bar graphs indicate relative levels of CCT2 and Stat3 in control and treated cells calculated as in Figure 2A-2C. (E) Image of stained PVDF membrane showing total protein corresponding to the samples blotted. Signal obtained from total protein was used to normalize CCT2 and Stat3 signal. (F) All five SCLC cell lines were treated with Stat3 Inhibitor IV at 50μM and 100μM. Untreated control received medium only at time of treatment. Live/Dead signal was detected and bar graphs generated as in Figure 3 and as described in Methods and Material. Representative images are shown. * = p<0.05, ** = p<0.01, *** = p<0.001, **** = p<0.0001.

