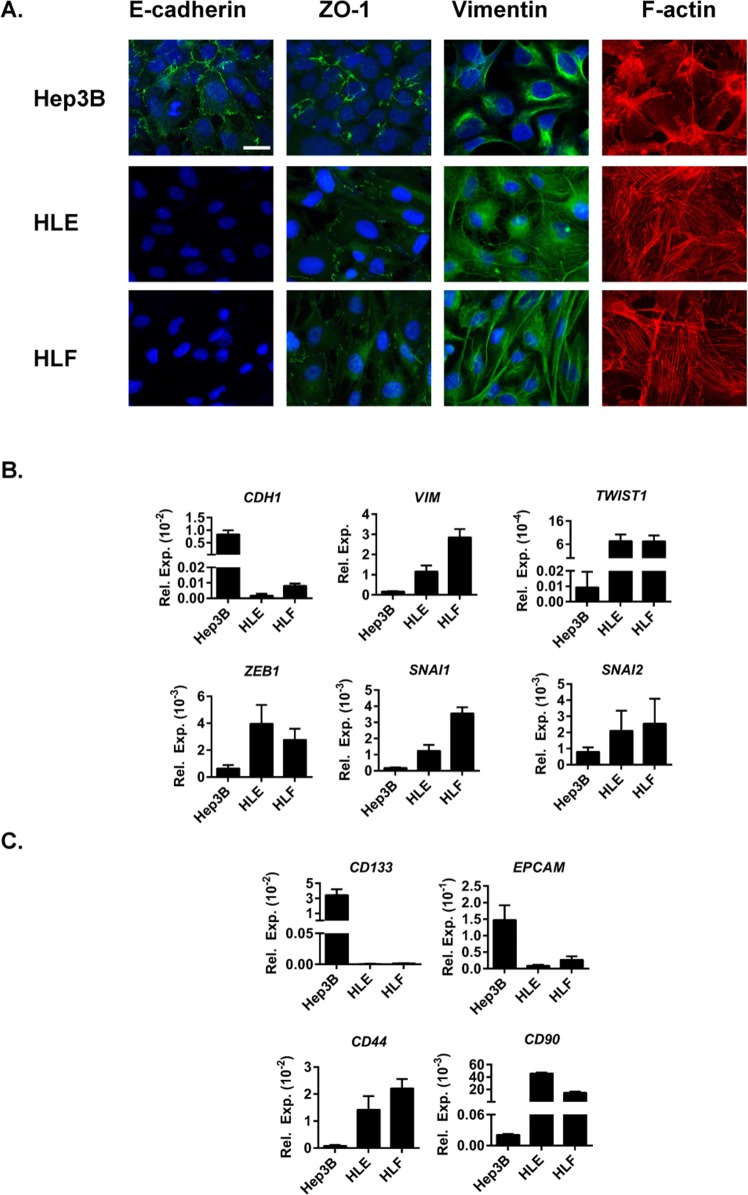
Figure 1. Characterization of HCC cell lines used in the study.
(A). Immunofluorescence analysis of E-cadherin (green), ZO-1 (green), vimentin (green), F-actin (red) and DAPI (blue). Scale bar =25 μm. (B+C). mRNA expression levels detected by qRT-PCR normalized to housekeeping gene L32. Mean±SD (n=3). (B). EMT-related genes CDH1, VIM and EMT-inducing transcription factors TWIST1, ZEB1, SNAI1 and SNAI2. (C). Stemnesss-related genes CD133, EPCAM, CD44 and CD90.

