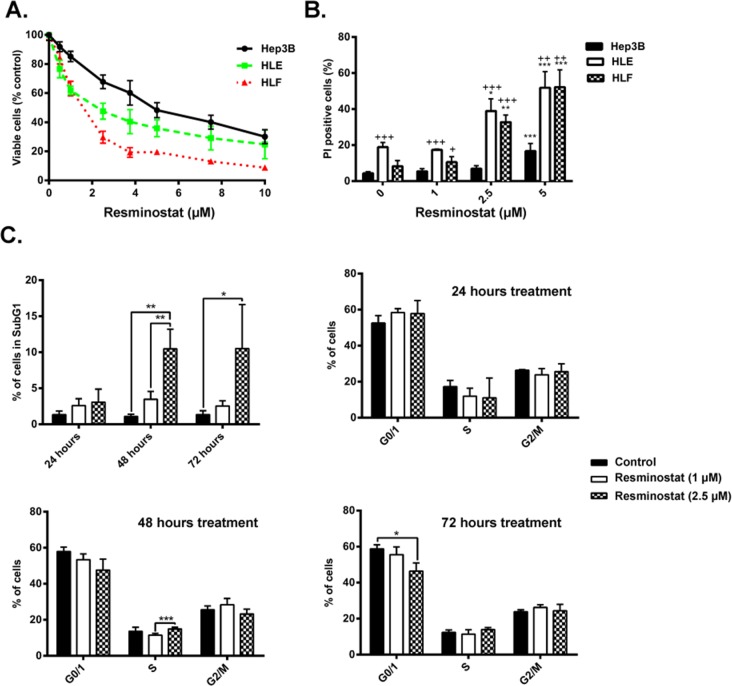
Figure 2. Response of HCC cells to resminostat treatment.
(A). Hep3B, HLE and HLF were treated with resminostat (0-10 μM) for 72 h. Viable cells were analysed by crystal violet staining and normalised to control. Mean±SD (n=3). (B). Hep3B, HLE and HLF were treated with resminostat (0, 1, 2.5, and 5 μM) for 72 h. The % of non-viable cells (PI-positive) was determined by flow cytometry. Mean±SD (n=3). * p< 0.05, ** p<0.01, *** p<0.001 as compared to control. + p<0.05, ++ p<0.01, +++ p<0.001 as compared to Hep3B. (C). HLF cells were treated with resminostat (0, 1 and 2.5 μM) for 24, 48 and 72 h. 2×10⁵ cells of respective samples were fixed with ethanol, and stained using PI for cell cycle analysis. Mean±SD (n=3). * p< 0.05, ** p<0.01, *** p<0.001.

