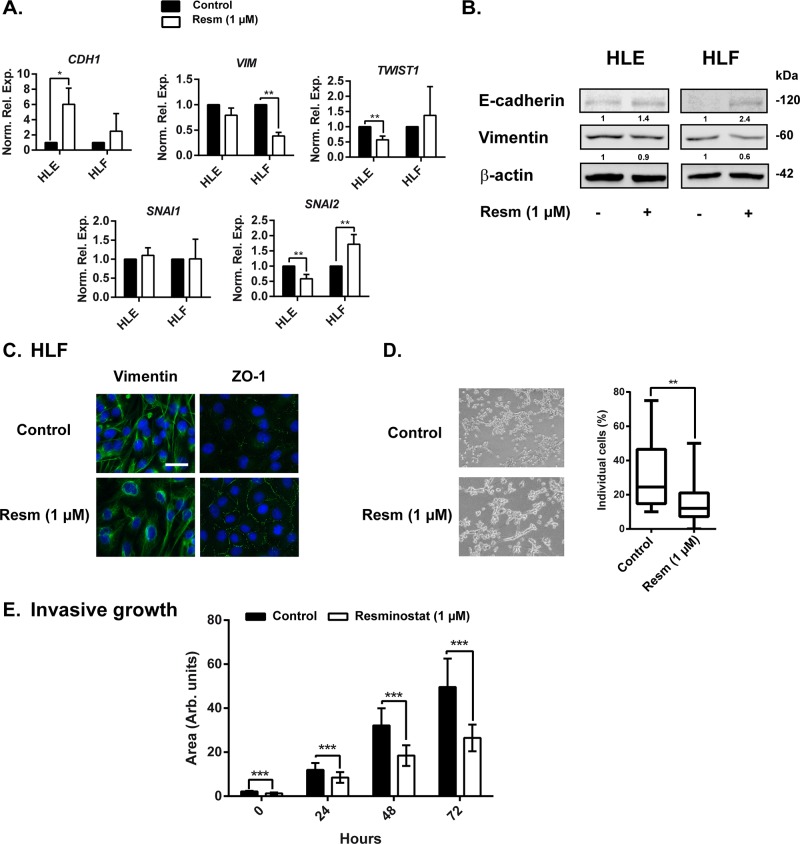
Figure 5. Resminostat affects the expression of EMT related genes.
(A). HLE and HLF cells were treated with resminostat (1 μM) for 24 h. mRNA expression levels were detected by qRT-PCR, normalized to housekeeping gene L32 and to respective control (resminostat 0 μM). (B). Western blot analysis of E-cadherin and vimentin in HLF cells after 24 hours of resminostat (1 μM) treatment. β-actin was used as a loading control. Densitometry analysis is below respective bands and normalized to β-actin. (C). HLF cells were treated with resminostat (1 μM) for 24 h. Immunofluorescence analysis of vimentin (green), ZO-1 (green) and DAPI (blue). Scale bar = 25 μm. (D). HLF cells were treated with resminostat (1 μM) for 72 h and seeded on top of a thick collagen I matrix. Left: Representative phase contrast images after 24 h (10x objective). Right: After 24 h, cells were stained using F-actin and DAPI, visualized by confocal microscopy and the % of individual cells was counted using ImageJ software. The % of individual cells is represented by a box plot with whiskers (min to max). Mann-Whitney t-test was used for statistical analysis. n=20 from a representative experiment. ** p<0.01. (E). HLF cells were treated with resminostat (1 μM) for 72 h and afterwards, the invasive growth in a Collagen I was analyzed. At respective times (0, 24, 48 and 72 h) of the invasion assay, phase contrast images were taken and the area of formed spheroid was analyzed by ImageJ software. *** p<0.001. Mean±SD (n at least 20 spheroids).

