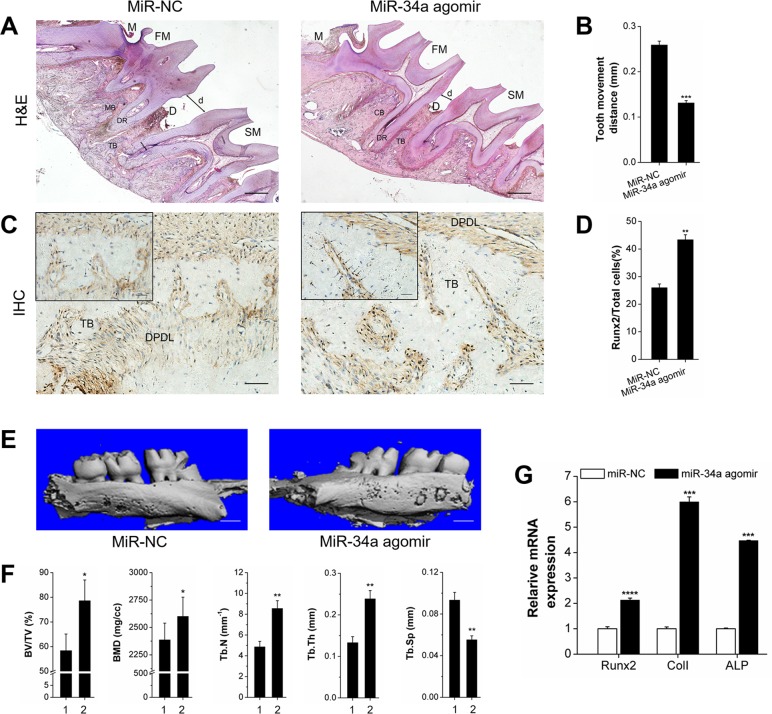
Figure 6. Osteogenesis analysis of OTM with local miR-NC or miR-34a agomir application in vivo.
(A) H&E staining showed the morphological characteristics and distance of tooth movement with local application of miR-34a agomir during orthodontic tooth movement for 14 days. Scale bars: 500 μm. n=3. (B) Statistical analysis of tooth movement distance. n=6. (C) Representative immunohistochemical staining showed Runx2+ cells of alveolar bone with local application of miR-34a agomir during orthodontic tooth movement for 14 days. Black arrows marked positively stained dark-brown granules. Scale bars: 100 μm and 20 μm. n=3. (D) Statistical analysis of Runx2+ signals in images similar to those shown in Figure 6C. (E) Three-dimensional images of the tooth movement and local alveolar bone for 14 days were tested by micro-CT. Scale bars: 1 mm. n=3. (F) Quantitative analysis of BV/TV, BMD, Tb.N, Tb.Th, and Tb.Sp. n=3. 1 and 2 presented the miR-NC lateral and miR-34a agomir lateral. (G) qRT-PCR analysis of osteogenic genes, Runx2, ColI, and ALP on miR-NC and miR-34a agomir lateral bone during OTM for 14 days. n=3. Data represent the mean ± SD of three independent experiments. *P<0.05 vs. the miR-NC lateral bone by paired t-test.

