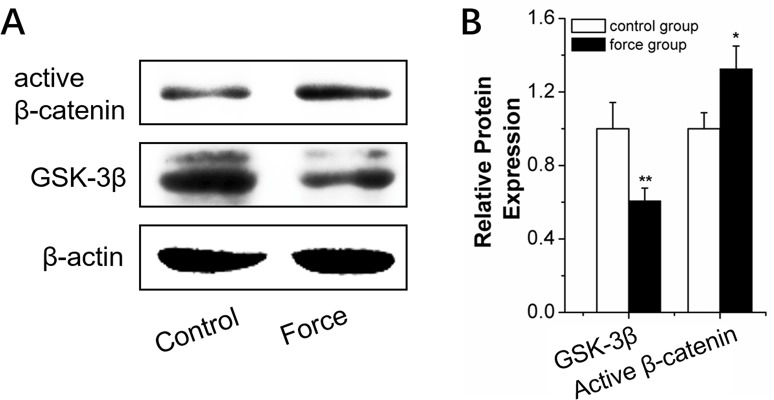
Figure 8. Wnt/β-catenin signal pathway analysis in BMSCs under strain.
(A and B) Western blot (quality in A and quantity in B) analysis of Wnt/β-catenin-signal-pathway-related proteins, GSK-3β, and active β-catenin for 2 h under strain loading. n=3. Data represent the mean ± SD of three independent experiments. *P<0.05 vs. the control group by paired t-test.

