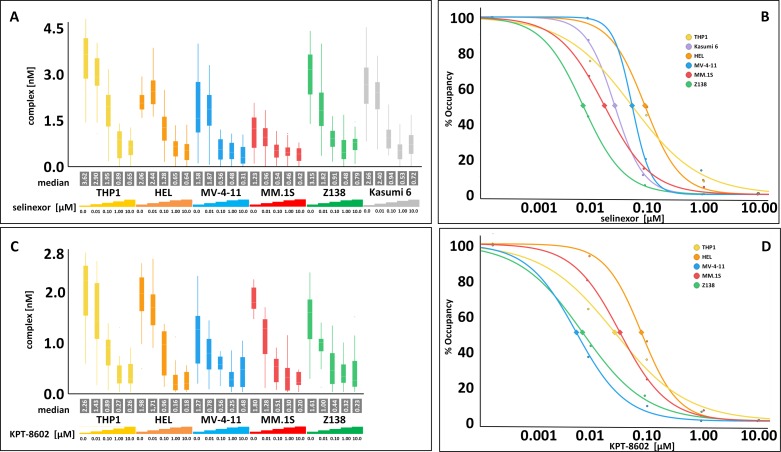
Figure 2. Selinexor and KPT-8602 dose-dependently occupy XPO1 in hematologic cell lines in vitro with no correlation to drug sensitivity.
(A) FCCS measurements of XPO1 occupancy from THP-1, HEL, MV-4-11, MM.1S, Z138, and Kasumi-6 cell lines grown to confluency and treated with 0, 0.01, 0.1, 1, and 10 μM selinexor for 4 hours. Cells were washed, harvested and lysed using PBS-Tween buffer and incubated with fluorescence labeled LMB (LMB647) at a concentration of approximately 25 nM and ATTO488 labeled anti XPO1 antibody (XPO1 AB488) for 2 hours and complex formation was analyzed on a ConfoCor2 Correlation Spectroscope. (B) The normalized (untreated = 100%) values for the XPO1 complexes were plotted for selinexor. (C) FCCS measurements of XPO1 occupancy from THP-1, HEL, MV-4-11, MM.1S, and Z138 cell lines grown to confluency and treated with 0, 0.01, 0.1, 1, and 10 μM KPT-8602 for 4 hours. Cells were washed, harvested and lysed using PBS-Tween buffer and incubated with fluorescence labeled LMB (LMB647) at a concentration of approximately 25 nM and ATTO488 labeled anti XPO1 antibody (XPO1 AB488) for 2 hours and complex formation was analyzed on a ConfoCor2 Correlation Spectroscope. (D) The normalized (untreated = 100%) values for the XPO1 complexes were plotted for KPT-8602. The resulting values were fitted to a logistic regression curve using the TIBCO Spotfire software package.

