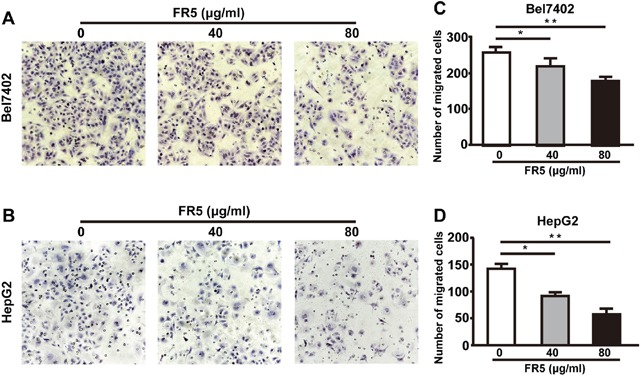
Figure 4. Effects of FR5 on Bel7402 and HepG2 cell migration.

Cell penetration through to the lower surface were stained with crystal violet and photographed under a light microscope. (A, B) Bel7402 and HepG2cells were cultured with FR5 at 0 (Ctrl), 40 and 80 μg/ml for 24 h, and representative pictures of migrated cells are shown. (C, D) The cell migration was quantified by counting migrated cells in five randomly selected fields at 24 h after seeding and presented as mean ± SD; *p<0.05; **p<0.01 vs. control group.
