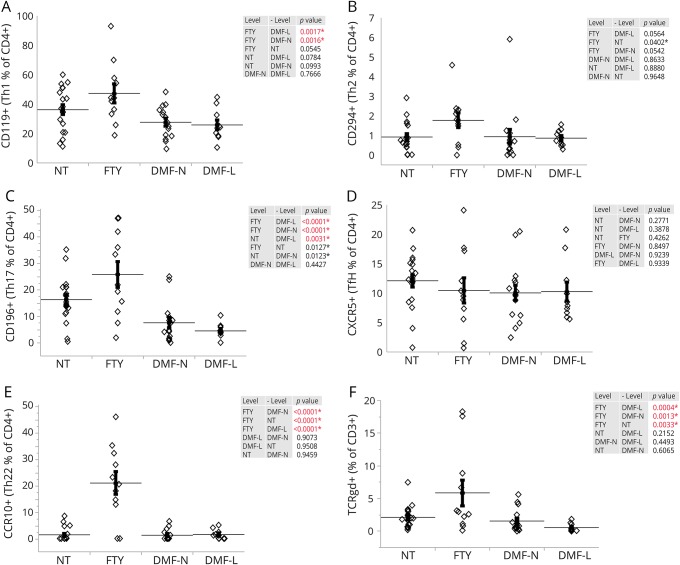
Figure 2. The frequency of helper T cells (Th) within CD4+ population and TCRγδ within CD3+ cells is affected by FTY and DMF treatment.
The proportion of Th within CD4+ cells was determined by flow cytometric analysis of peripheral blood for identification of Th1 by CD119+ cells (A), Th2 by CD294+ cells (B), Th17 by CD196+ cells (C), Tfh by CXCR5+ cells (D), and Th22 by CCR10+ cells (E). (F) The frequency of TCRγδ within CD3+ T cells. The horizontal lines indicate the average mean of each group, and the bars are the SEM. p Values are indicated as insets; those reaching statistical significance are highlighted in red. DMF = dimethyl fumarate; FTY = fingolimod; NT = untreated; PBMC = peripheral blood mononuclear cell.

