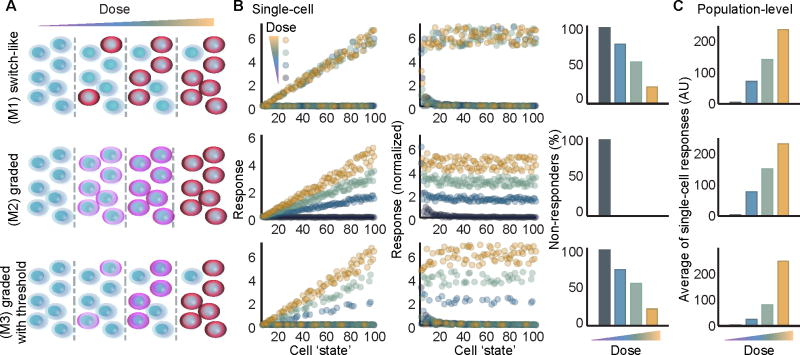
Figure 1. Population-level data cannot distinguish between switch-like and graded response mechanisms.
(A) Schematic for (M1) a switch-like mechanism for activation where a cytokine dose increases the probability of an all-or-nothing response in each cell; (M2) a graded mechanism for single-cell activation in which each cell’s response is graded in proportion with increasing cytokine dose; and (M3) a combined threshold with graded mechanism where single cells responses are graded in proportion with cytokine dose only if the dose is greater than the cell’s threshold for activation. (B) Simulated responses of single cells modeled with extrinsic noise (described in Figure S1). Each cell is initialized in a unique ‘cell state’ that approximates its responsiveness to cytokine. Responses to 4 doses are compared in each model plotted as a raw response (left), or a normalized response that divides each cell’s response by its ‘cell state’ (middle). The fraction of non-responder cells is quantified for each dose (right). (C) Three mechanistically distinct models are indiscernible when using the average of single cell responses to approximate a population-level measurement. See also, Figure S1.

