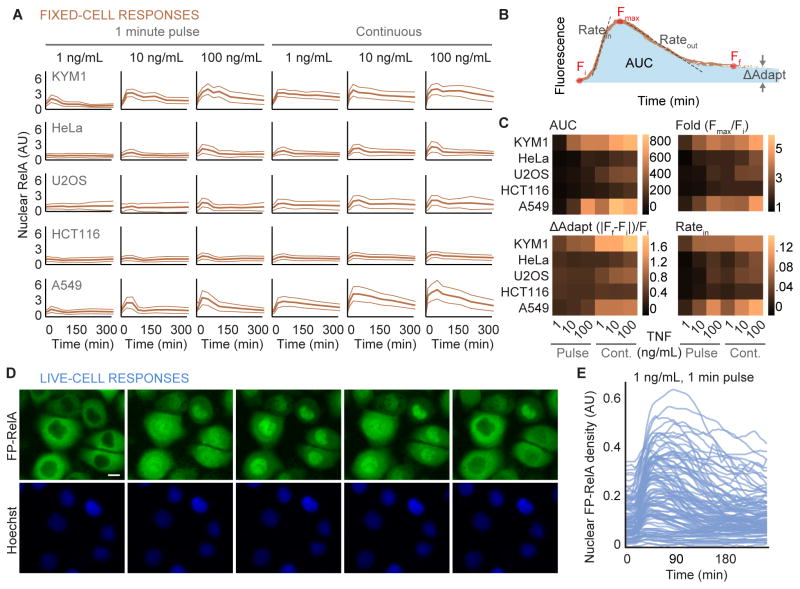
Figure 2. Heterogeneity of responses to TNF between cell lines and single cells.
(A) Time courses for average nuclear RelA from fixed cells are shown for a panel of human cell lines exposed to indicated concentrations of TNF continuously or as a single 1-minute pulse (solid orange curve). On average, 11374 single cells were measured across the time points for each cytokine condition. Light colored lines indicate the standard deviation of approximately 1274 cells measured at each time point. Time points for fixation included 0, 10, 30, 60, 90, 120, 180, 240, and 360 minutes following exposure to TNF. (B) Descriptors used to quantify the response of cells to a cytokine. Fi, Fmax, and Ff respectively describe the initial, maximal, and final amount of nuclear RelA fluorescence. AUC defines the area under the curve for the cytokine response and ΔAdapt quantifies the deviation from a perfect adaptive response. Ratein and Rateout quantify the maximal rate of nuclear entry and exit respectively for average of fixed-cell data. (C) Heatmaps for each descriptors quantified in a panel of cell lines exposed to indicated cytokine conditions. Formulae used to calculate ΔAdapt and fold change (Fold) are shown. See also, Figure S2. (D) Time-lapse images of FP-RelA stably expressed in KYM1 cells exposed to a single 1-minute pulse of 1ng/mL TNF; scale bar, 10 μm, see also Movie S1. (E) Time courses of nuclear FP-RelA density measured in single cells treated with a 1-minute pulse of 1 ng/mL TNF. See also, Figure S2 and Table S1.

