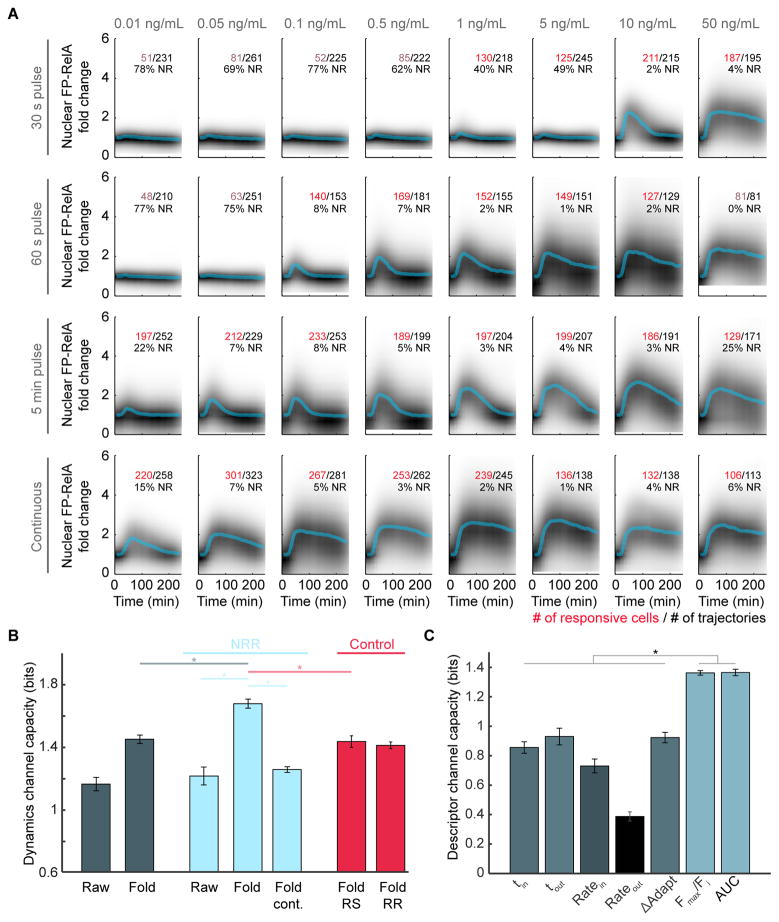
Figure 3. Information Transmission Capacity of the TNF-NF-κB pathway.
(A) Density plots of single-cell FP-RelA time courses for responses to TNF with indicated concentration and duration. Median of single-cell responses for each condition is shown in blue. Inset numbers indicate the total number of single-cell time courses collected (black), the number of cells with a significant amount of FP-RelA translocation (red or pink), and the fraction of non-responders (NR) for each condition. (B) Channel capacity values calculated for each data set: (dark blue) ‘Raw’ and ‘Fold’ data sets where each single-cell time course is represented in arbitrary units or fold change (Figure S3A); (light blue) ‘NRR’, data sets where time courses for non-responder cells are removed, the ‘Fold cont.’ data set only includes conditions from the Fold-NRR with continuous exposure to TNF (bottom row of panel A); (red) Average of 20 subsample control data sets where the same number of cell trajectories are removed from the ‘Fold’ data set as in the NRR, but cells were either ‘Randomly Selected’ (Fold RS) or ‘Responding cells were targeted for Removal’ (Fold RR) (See STAR methods). For all data sets, conditions with fewer than 100 responder cells (pink numbers in panel A) were removed from channel capacity calculations; p < 10−12, t test. (C) Channel capacity values for scalar descriptors of FP-RelA dynamics (p ≪ 10−13, t test). Error bars represent standard deviation. See also Figure S3.

