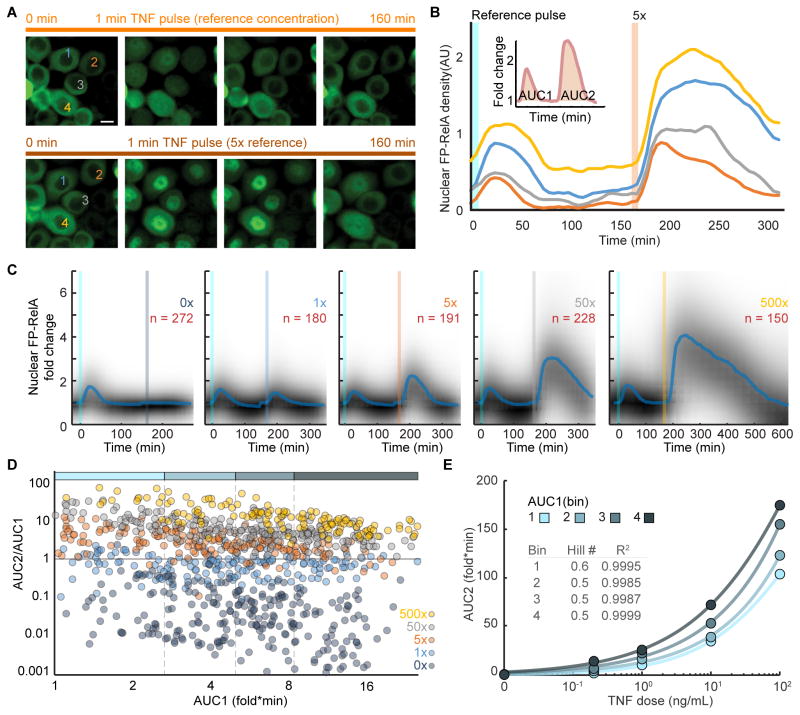
Figure 4. Repeat TNF Stimulation Reveals a Graded Mechanism of Dose Discrimination in Single Cells.
(A) Time-lapse images of FP-RelA in live cells stimulated with a 1 minute reference pulse of 0.2 ng/mL TNF, followed by a 1 minute pulse with 5x the reference dose (1 ng/mL TNF). Same cells are marked; scale bar, 10 μm; see also Movie S2. (B) Representative single-cell time courses for the cells labeled in (A). Inset shows schematic of area under the curve calculations for single-cell responses to the first (AUC1) and second (AUC2) TNF pulse (C) Density plots of single-cell FP-RelA time courses for cells exposed to a reference TNF pulse followed by a range of increasing test doses. Median of single-cell responses is shown in blue and inset numbers indicate the number of single cell time courses collected in each condition. (D) Scatter plots showing AUC2/AUC1 stratified along AUC1 across the range of test conditions. Colored bar along top depicts bins of single cells based on AUC1 into an approximately equal number of cells per condition. (E) Average response of single cells (AUC2) to increasing ‘test pulse’ concentrations (0, 0.2, 1, 10, or 100 ng/mL TNF) for each bin in panel D; inset describes hill coefficients and goodness of fit for logistic regression. See also, Figure S4 and Table S2.

