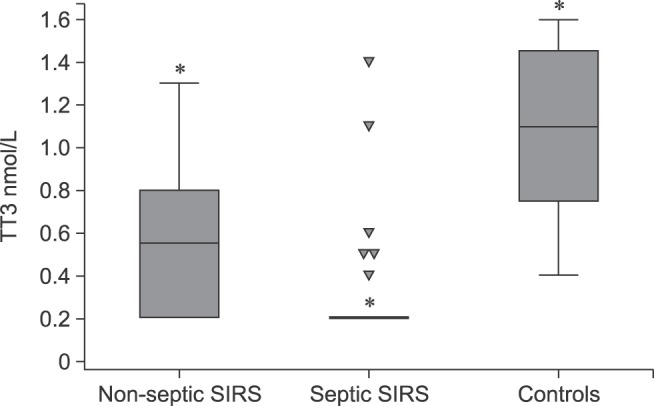
Fig. 1. Box plots of serum total triiodothyronine (TT3) concentrations among dogs with non-septic systemic inflammatory response syndrome (SIRS), dogs with septic SIRS, and control dogs; the central box represents the values from the lower to upper quartile (25 to 75 percentile). The middle line represents the median. The vertical line extends from the minimum to the maximum value, excluding outside and far out values which are displayed as down-pointing triangles. Asterisk indicates significant (p < 0.05) differences among groups.

