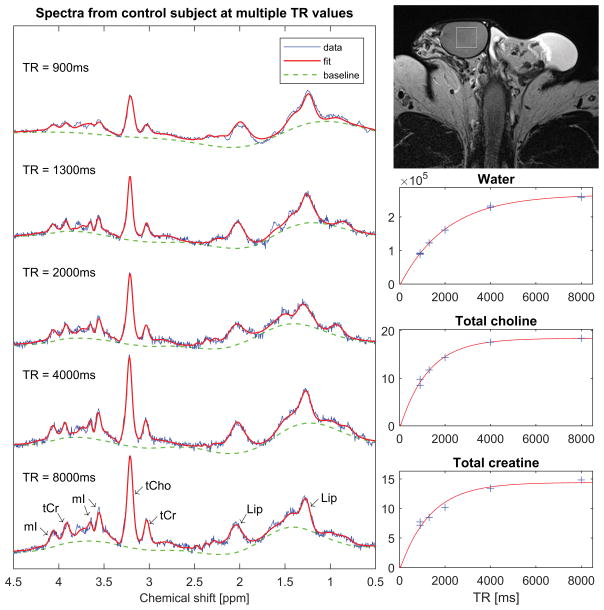
Figure 3.
Single-voxel spectra from a 41-year old control subject. The spectra were acquired with TE = 40ms and multiple TR values for estimation of metabolite T1 times. The vertical and horizontal scales are identical across all spectra to facilitate comparison of the signal amplitudes at different TR values. On the top right is an axial T2-weighted FSE image showing placement of the spectroscopy voxel. Below the image are graphs showing fits of the water and metabolite signals as a function of TR to saturation-recovery curves.

