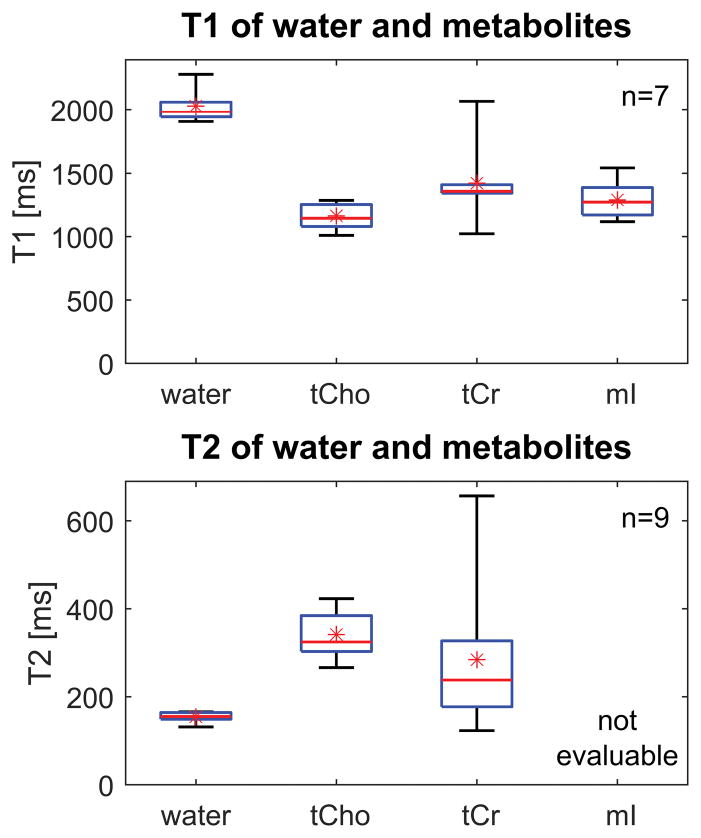
Figure 5.
Box-and-whisker plots showing T1 and T2 values for water and metabolites measured over the control subjects. Medians are displayed using a horizontal line, while means are indicated with an asterisk. The T2 of mI could not be measured reliably due to strong J-coupling. The large range of values for tCr reflects its low SNR, which produces more scatter in its T1 and T2 measurements.

