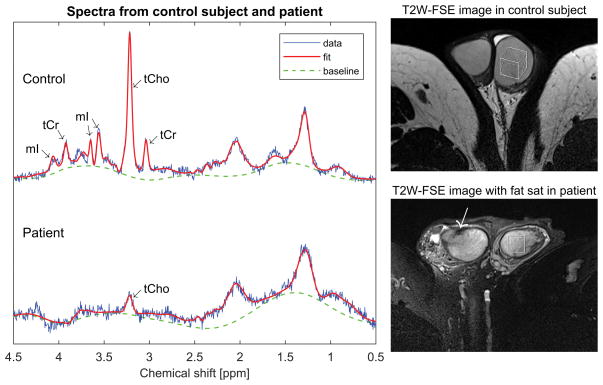
Figure 6.
Single-voxel spectra from a 35-year old control subject (top) and a 33-year old azoospermic patient with germ cell aplasia (bottom). The vertical scale is normalized to the water signal in both cases. Note that the patient has a much smaller tCho peak than the control subject and no discernable tCr or mI peaks. To the right are axial T2-weighted FSE images from the control subject (top) and the patient (bottom) showing the locations of the spectroscopy voxel. The patient image was acquired with fat saturation, and demonstrates a prominent rete testis (arrow) and some signal heterogeneity in the testicular parenchyma.

