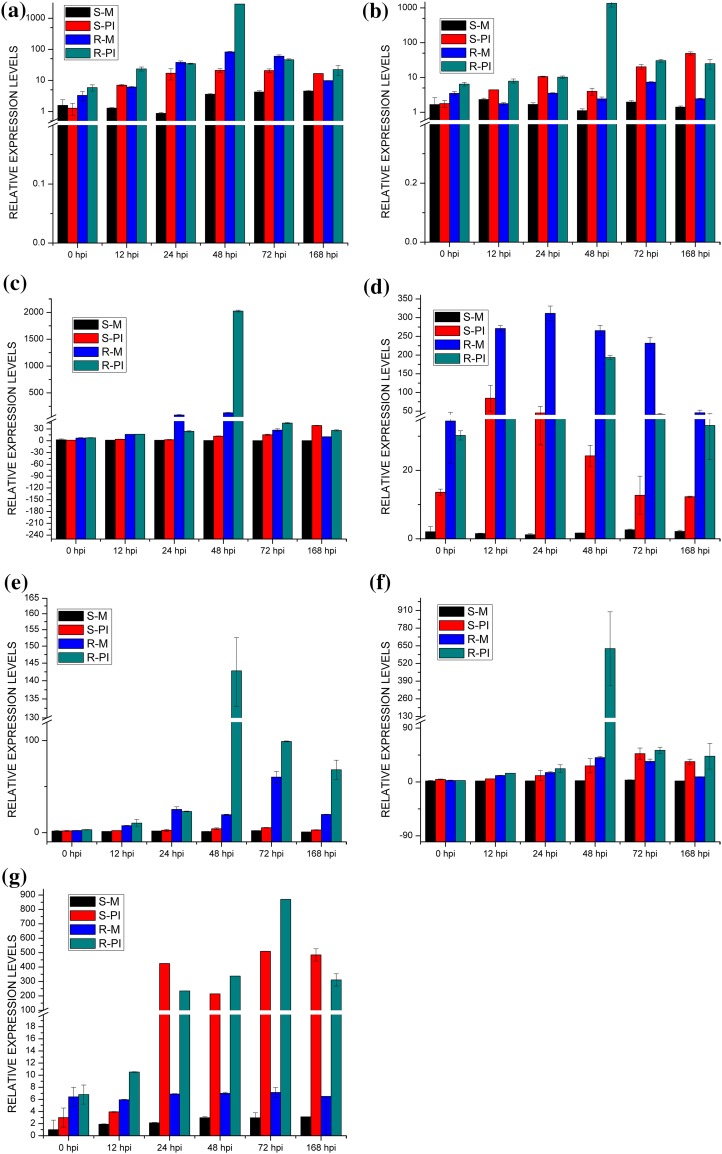
Fig. 4.
Relative gene expression profiles of WRKY genes a WRKY49, b WRKY50, c WRKY52, d WRKY 53, e WRKY55, f WRKY57, g WRKY62 during pathogen-induced biotic stress. Expression profiles of susceptible (HD2329) and resistant (HD2329 + Lr28) wheat plants in response to leaf rust infection compared with mock-inoculated controls. The time points correlated with the formation and development of different infection structures as described by Hu and Rijkenberg (1998) are shown at the bottom. Relative expression is expressed as fold changes relative to mock-inoculated controls. The values on the y-axis indicate relative expression, whereas the x-axis denotes the selected time points (hour post inoculation). Data represent means of two replicate reactions from three biological repeats with error bars indicating standard deviations (SD)

