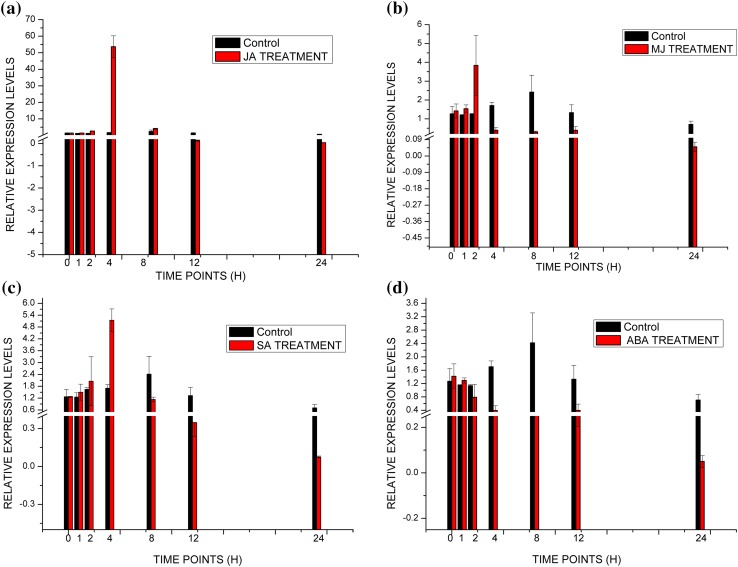
Fig. 5.
Relative expression levels of TaWRKY62 on treatment with a JA, b MJ, c SA and d ABA Relative expression is expressed as fold changes relative to mock-inoculated controls. The values on the y-axis indicate relative expression, whereas the x-axis denotes the selected time points (hour post inoculation). Data represent means of two replicate reactions from three biological repeats with error bars indicating standard deviations (SD)

