. 2017 Dec 11;26(6):369–379. doi: 10.5607/en.2017.26.6.369

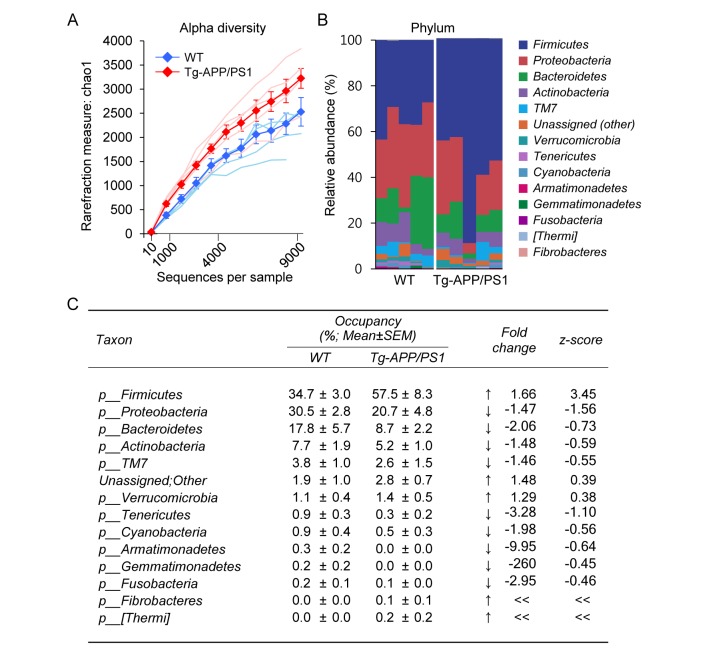
Fig. 1. The diversity and composition of microbiota at the phylum level in wild-type and Tg-APP/PS1 mice. (A) Rarefaction curves representing the number of OTUs for each sample (fine lines) and the mean OTUs (thick lines and filled circles) +/− SEM over the identified sequences in wild-type control (blue) and Tg-APP/PS1 mice (red) (n=5, each). (B) Clustered stacked columns representing the overall compositions of microbiomes at the phylum level in wild-type control and Tg-APP/PS1 mice. Those of occupancies 0.1% and higher in wild-type control and/or Tg-APP/PS1 mice are presented. (C) The percent compositions, fold-changes and z-scores of microbiomes at the phylum level in wild-type and Tg-APP/PS1 mice. Data are presented as the mean percentage +/− SEM (n=5, each). The z-score is X − µ/σ, where µ=mean; X=individual score; σ=standard deviation (SD). Increases and decreases of the mean occupancy by more than one z in Tg-APP/PS1 are marked by ↑ and ↓, respectively. « and » denote infinite increases and decreases, respectively.

Fig. 1