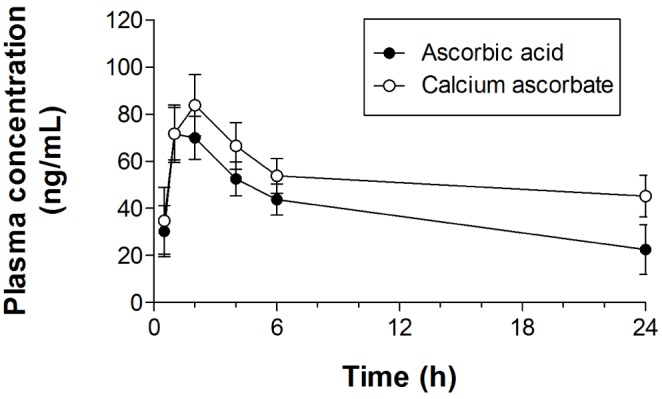
Fig. 5. Blood concentration of ascorbic acid after oral administration.

Plasma concentration versus time profiles obtained after the administration of ascorbic acid (105.96 mg/kg) and calcium ascorbate (135.24 mg/kg). Values for each time point are expressed as the mean±SEM (n=6).
