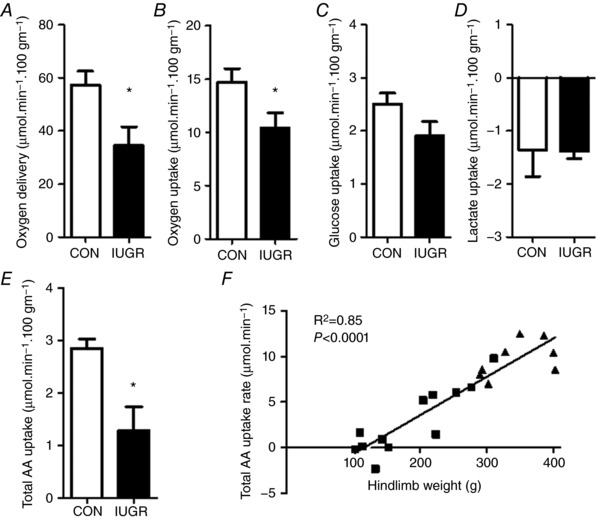
Figure 2. Net hindlimb substrate uptake rates and oxygen delivery.

A, oxygen delivery rate to the hindlimb, as well as net hindlimb uptakes rates for oxygen (B), glucose (C), lactate (D) and total amino acids (E) (AA) in CON (white bars, n = 8) and IUGR (black bars, n = 11) fetal sheep at 134 days of gestation. All uptake rates and oxygen delivery normalized to 100 g of hindlimb weight. Values represent the mean ± SEM. * P < 0.05 by Student's t test or the Mann–Whitney test. F, linear relationship between total amino acid uptake rate and hindlimb weight. IUGR fetuses (squares) and CON fetuses (triangles) with correlation coefficients and P values are shown.
