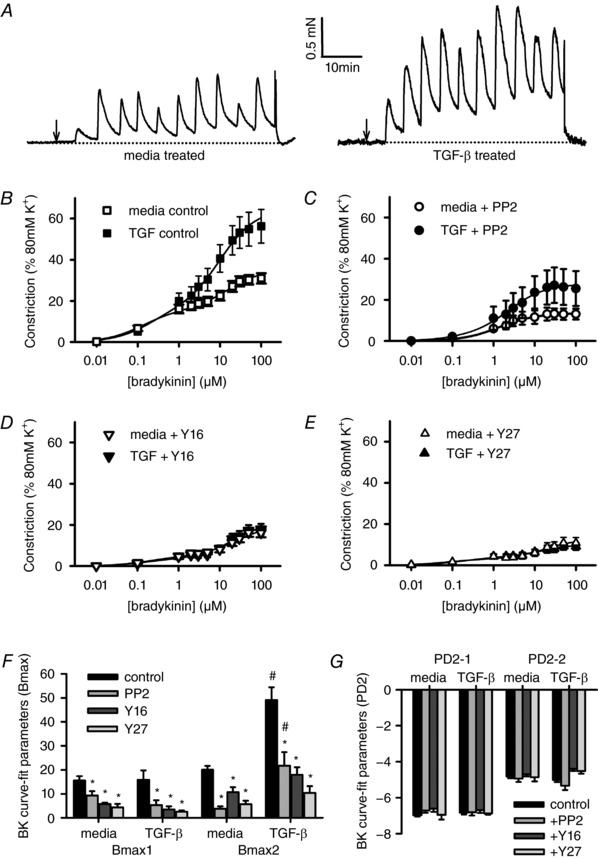
Figure 1. Effects of TGF‐β and SrcFK/RhoGEF/Rho‐kinase inhibition on BK‐induced contraction.

Measurement of isometric tension in isolated rat bronchioles mounted on the wire myograph. A, representative traces showing bradykinin (BK) applied cumulatively (0.01–100 μm) at 5 min intervals, after 18 h pre‐incubation in media only or in media with 30 ng ml−1 TGF‐β. Arrows indicate when the first dose of BK was applied. B–E, mean contraction amplitude after TGF‐β or media pre‐incubation measured at the plateau phase of each BK application, in the absence (B, media: n = 24, TGF‐β: n = 23) or presence of 30 μm PP2 (C, media: n = 17, TGF‐β: n = 15), 30 μm Y16 (D, media: n = 9, TGF‐β: n = 9) or 10 μm Y27632 (E, media: n = 9, TGF‐β: n = 9). F and G, non‐linear regression data, showing effects of TGF‐β and inhibitors on Bmax (F) and PD2 values (G). * P < 0.05 vs. control, # P < 0.05 vs. media, two‐way ANOVA.
