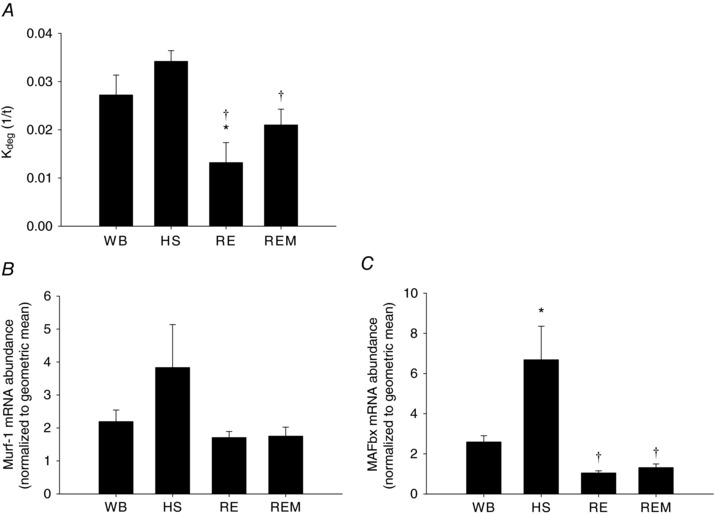
Figure 4. Effect of massage on muscle protein degradation.

Calculated protein degradation rate, K deg 1/t (A), RNA abundance of Murf‐1 (B) and MAFbx (C) from gastrocnemius muscles of WB (n = 8), HS (n = 7), RE (n = 8) and REM (n = 8) rats. Values are means ± SEM. One‐way ANOVA followed by Tukey's post hoc test was used to determine statistical significance: *different from WB, †different from HS, P < 0.05.
