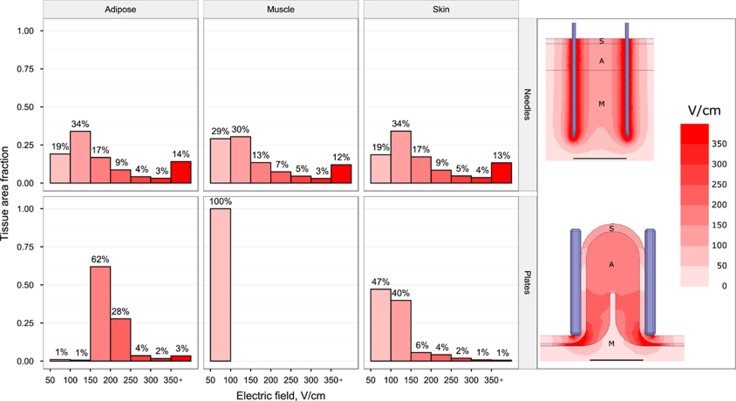
Figure 2.
Simulated electric field distribution within different tissue types for needle (top) and plate (bottom) electrode configurations using a 200 V excitation voltage for each case. The histograms (from left to right: adipose, muscle, skin) quantify the electric field distribution within each tissue type for electric fields above 50 V cm−1. The images on the right show spatial electric field distributions for each configuration, with outlines and labels for skin (S), adipose (A) and muscle (M). Scale bar is 10 mm.

