
Figure 3.
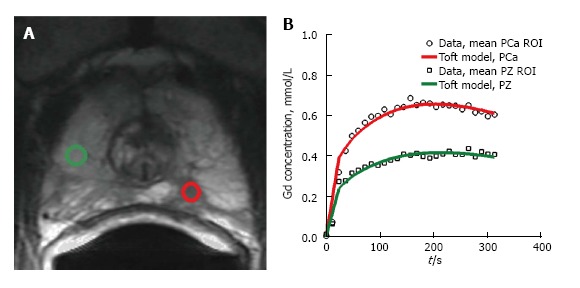
Example of enhancement kinetics pattern from two regions-of-interest. A: Transverse T2-weighted image. The green regions-of-interest (ROIs) corresponds to a benign PZ region. The red ROI corresponds to region with prostate cancer; B: Contrast curves of the two ROIs shown in A. The curves are characteristic of the types of time-intensity curves obtained with dynamic contrast-enhanced MRI. The green ROI shows moderately slow and slight enhancement wash-in pattern. This is characteristic for many benign, enhancing tissues, such as normal prostate tissue. The red ROI shows a rapid rise in signal intensity with subsequent wash-out as is typical in tumors.