
Figure 4.
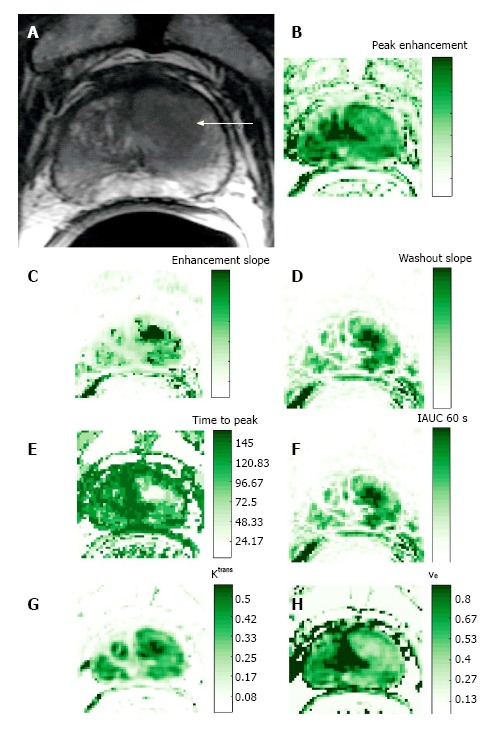
Representative 3T data in 63-year-old patient with prostate cancer (presurgical prostate-specific antigen level, 3.4 ng/mL). A: Transverse T2-weighted image. Pharmacokinetic parameter maps based on the semi-quantitative method and the Toft’s kinetic model. Parametric maps for the semi-quantitative parameters, including; B: Peak-enhancement; C: Enhancement slope; D: Wash-out slope; E: Time-to-peak; and F: Intensity curve or contrast medium concentration at 60 s. Using the Toft’s kinetic model, the pharmacokinetic parameter maps for G Ktrans and H ve are shown.