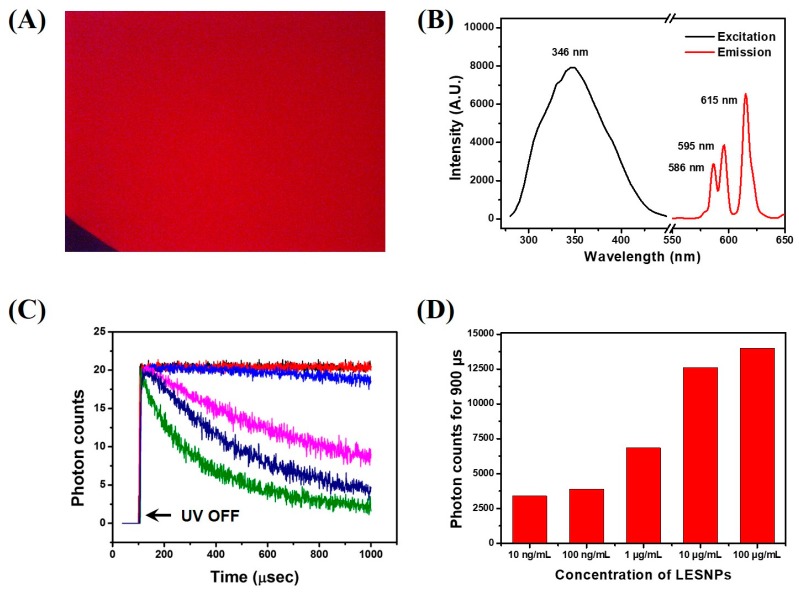
Figure 4.
Optical property analysis of the LESNP. (A) fluorescence microscopy image of the LESNP in solution; (B) excitation and emission spectrum of the LESNP; (C) TRL photon counts curve, obtained using the LESNP at various concentrations (0–100 μg/mL); (D) integrated photon counts for the LESNP obtained at various concentrations (0.01–100 μg/mL).

