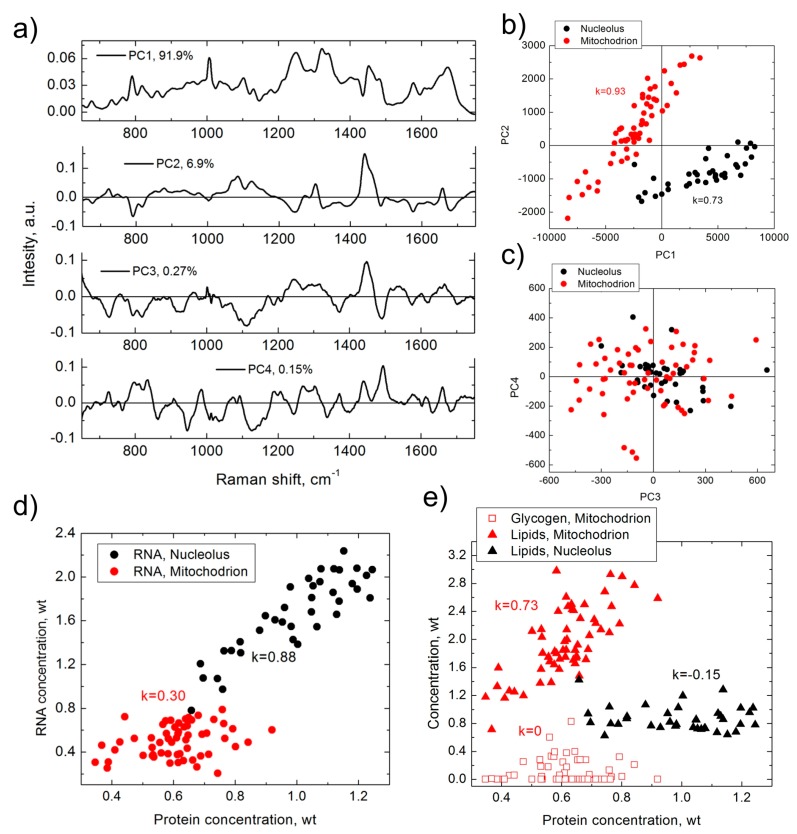
Figure 1.
Results of PCA (a–c) and BCA (d,e), obtained from the same set of Raman spectra measured in nucleoli (black) and mitochondria (red) of HeLa cells. (a) first four principal components (corresponding contribution is shown in graph); (b) PC2 versus PC1 score distribution; (c) PC3 versus PC4 score distribution; (d) RNA versus proteins concentration; (e) lipid/glycogen concentrations versus protein concentration. k is Pearson correlation coefficient. Weight units correspond to 100 mg/mL for proteins and 20 mg/mL for RNA, lipids and glycogen.

