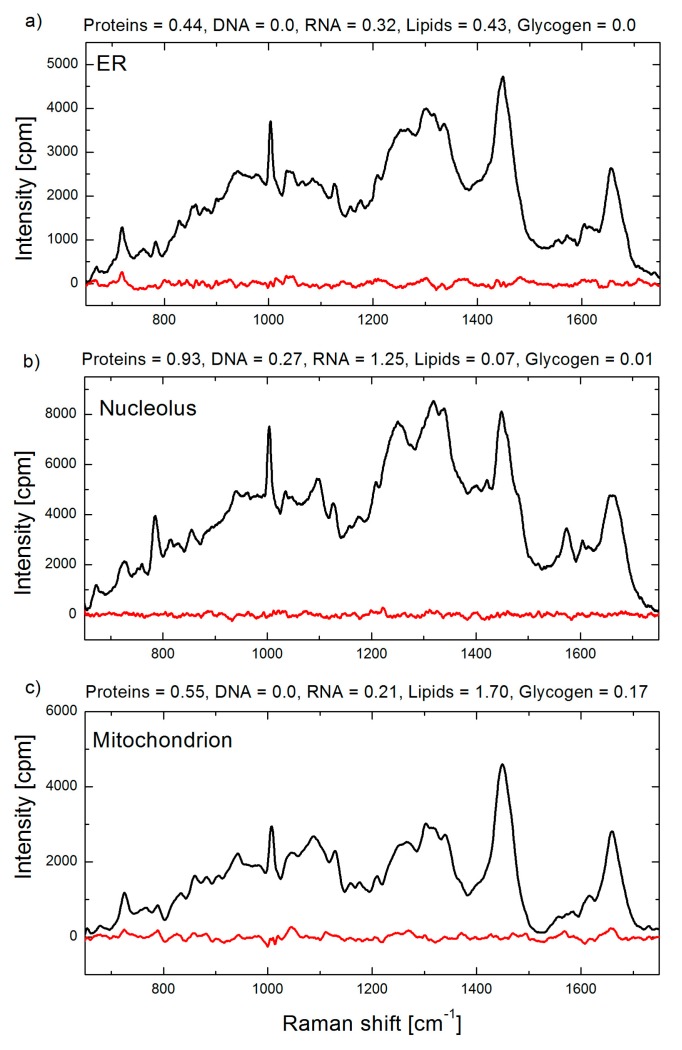
Figure 4.
Raman spectra of a single organelle: (a) endoplasmic reticulum; (b) nucleolus; and (c) mitochondrion in live HeLa cells. Raman spectra are shown in black and corresponding residual spectra obtained by BCA procedure are shown in red. Biomolecular weights obtained by BCA are indicated in arbitrary units, which for this example correspond to 100 mg/mL for proteins, and 20 mg/mL for DNA, RNA, lipids and saccharides, respectively.

