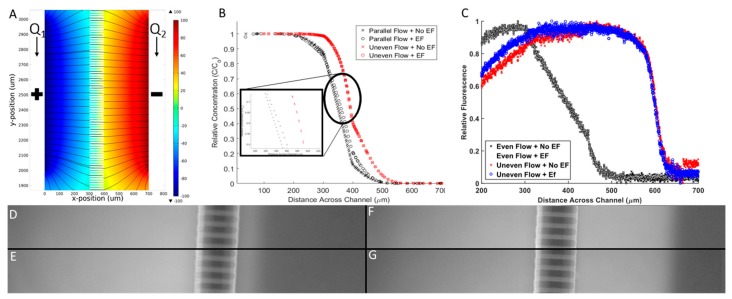
Figure 5.
Electrical and chemical microenvironment of Gal-MµS. (A) Computationally-derived profiles of electric fields within the Gal-MµS using electric field strength = 100 mV/mm. (B) Computationally-derived, steady-state concentration profiles of a model molecule (10 kD dextran) using 4 combinatory fields: even flow (Q1 = Q2), with and without an applied electric field (100 mV/mm), and uneven flow (Q1 > Q2), with and without an applied electric field (100 mV/mm). (C) Experimental measurement of molecular transport within the device using the 4 combinatory fields. Note axes have been modified to better illustrate position of experimental data. Fluorescent images for the 4 stimulation conditions: (D) Even flow with no applied electric fields (EF), (E) even flow with EF, (F) uneven flow with no EF, and (G) uneven flow with EF. All images were taken within the region between the two electrodes.

