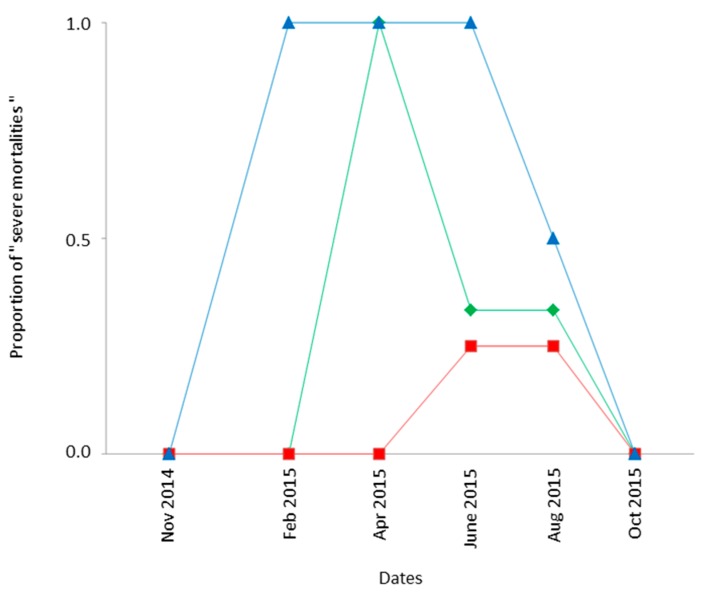
Figure 3.
Spatiotemporal distribution of “severe mortality” of pre-imaginal Drosophila suzukii (Ds). The term “high mortality” refers to cases where the number of Ds from closed traps exposed in the field (Method 3; “Frozen Fruits” method) represents less than 10% of their number in the corresponding laboratory controls. Based on the analysis of deviance, data from the two “locations” within each “habitat” were pooled. Green diamonds, red squares, and blue triangles, respectively, represent the “low elevation—cultivated” (BAR and STJ), “low elevation—natural habitat” (BIO and TIG), and “mountainous backlands” (CIP and FER) areas (see also Table 1).

