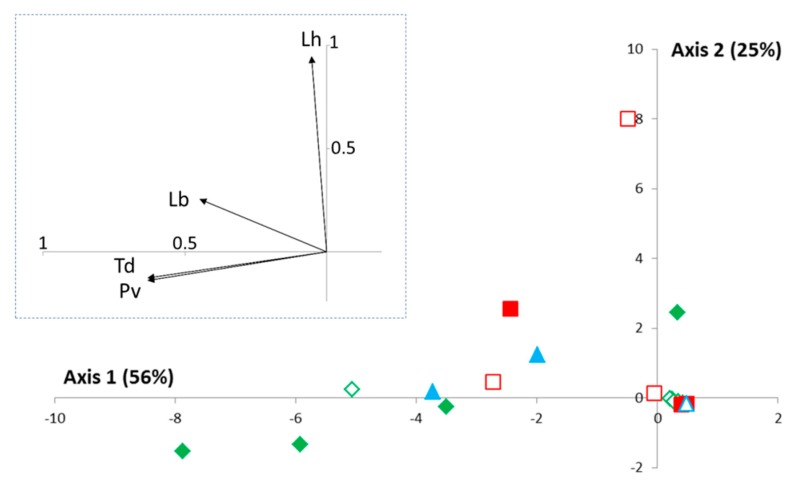
Figure 4.
Principal components analysis (PCA) on parasitoids collected in Condition 1 (fruits alone) of the “Frozen Fruits” method. The PCA analysis was performed from the distribution of the different parasitoid species in each of the “location/replicas x date” combinations. The associated inertia is provided for each axis. The code for the “location” is as follows (see also Table 1): (i) Green = low elevation—cultivated area (plain signs = BAR; empty signs = STJ); (ii) Red = low elevation—natural habitat (plain signs = TIG; empty signs = BIO); (iii) Blue = mountainous backland (plain signs = CIP; empty signs = FER). Contrary to Figure 1, the temporal dynamics were not explicitly shown here (see Results). The correlations between each PCA axis and each parasitoid species are presented in the grey square (rescaled and shifted for a better readability). Lb, Lh, Pv, and Td correspond to Leptopilina boulardi, L. heterotoma, Pachycrepoideus vindemmiae, and Trichopria cf drosophilae, respectively.

