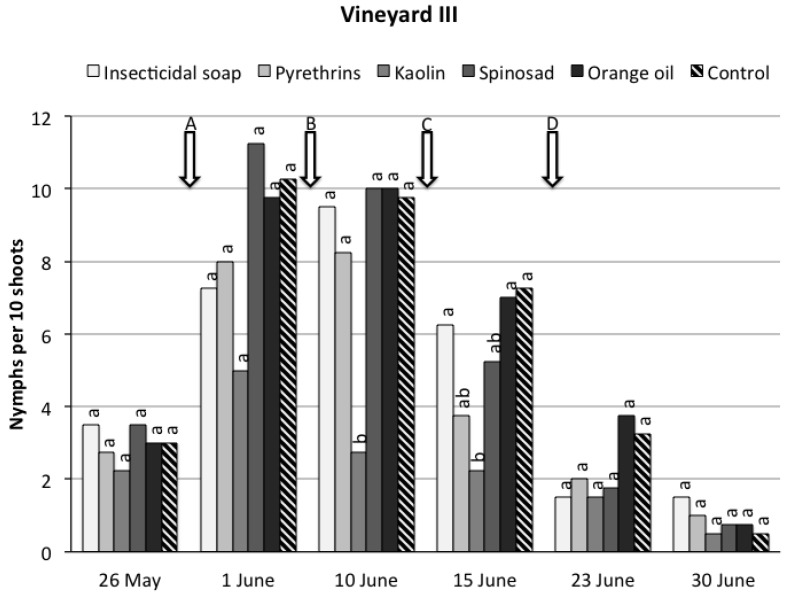
Figure 3.
Scaphoideus titanus nymphs recorded on grapevine suckers during the sampling period in vineyard III under six different treatments. Within the same date, different small letters above bars indicate significant differences according to t-tests on the least square means with Bonferroni correction (α = 0.05). The arrows indicate the application timings of application of the natural products.

