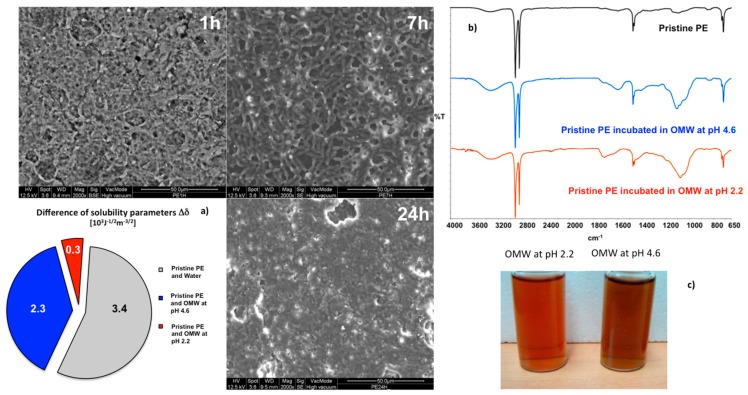
Figure 3.
SEM micrograph collected onto the fouled PE membrane surface after 1, 7, and 24 h of incubation in olive mill wastewater (OMW) solution at pH 2.2 and related affinity with various solutions (a); ATR spectra collected onto PE membranes incubated in OMW2.2 and OMW4.6 (b); Picture related to OMW solutions at pH 2.2 and 4.6 (c).

