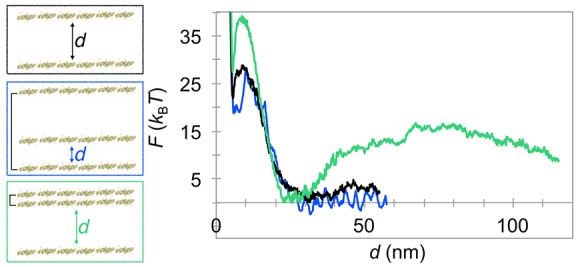
Figure 3.

Interactions among multiple N-BAR filaments. Left are shown protein configurations from CG MD simulations used to calculate the potential of mean force, F, as a function of distance between two filaments of interest, d, as displayed in the plot on the right. In the center and bottom configurations, the black line connects two filaments whose distance was kept constant throughout the simulation. The colors in the plot match the colors in the protein configurations. The black plot serves as a control of only two filaments. All filaments contain six N-BARs. CG MD simulations were carried out at ∼0.15 mN m–1. Maximum error per PMF calculation (in kBT) for, respectively, black, green, and blue plots is ±1.6, ± 1.1, and ±1.1. The Boltzmann constant is kB, and T is the thermodynamic temperature.
