Figure 4.

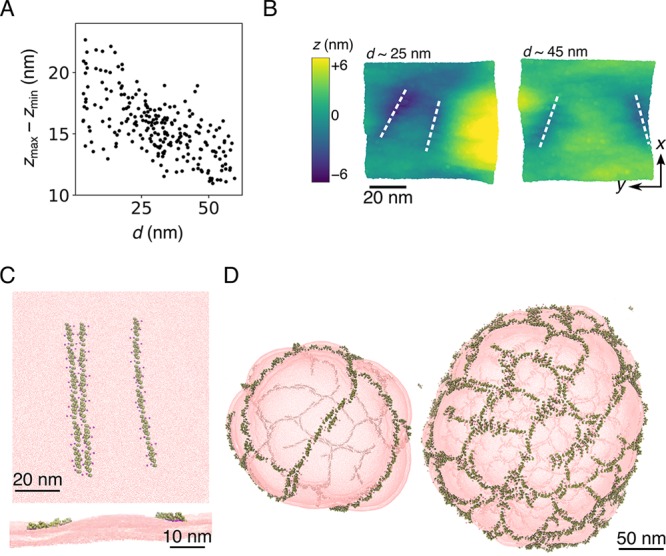
N-BARs forming striped patterns and meshes. (A) Maximum membrane deformation, zmax–zmin, vs the interfilament distance, d, for the CG MD simulation of six N-BARs per filament at vanishing tension. It was calculated for individual snapshot considering only the top CG lipid site of the protein-bound layer, and it is measured for the whole simulated membrane. (B) Top-view of example snapshots at different filament separations, d, and color-coded based on the height, z. Zero on the scale denotes the mean position of the single layer. White dashed lines denote locations of N-BAR protein filaments. Shown is a patch of the membrane near the proteins. (C) Top view (top panel) and side views (bottom panel) of the membrane deformation caused by approaching filaments for the case of a line approaching two adjoined lines at nonvanishing tension. The example of strongest repulsion observed is shown, demonstrating a deformation in between filaments. The snapshot is taken from the CG MD simulations presented in Figure 3. (D) Final snapshots of a CG MD simulation of N-BARs on liposomes at 20% (left) and 30% (right) protein surface coverage. Protein filaments have a strong propensity to spontaneously form a parallel arrangement (left). As the protein density increases, the filaments cross-link into meshes (right). The configurations were rendered from data generated in our previous work.25 In the depiction, the membrane is semitransparent, and the fainter lines are N-BAR filaments on the opposite side of the vesicle.
